Pie Graph vintage illustration. Royalty Free Vector Image
-
IMAGE ID: 28237922
-
contributor: Morphart
Hey! Remember you have to attribute Morphart
Copy the following link on the web you will be using this resource. If you want more information read the attribution guide or download the license.
Description
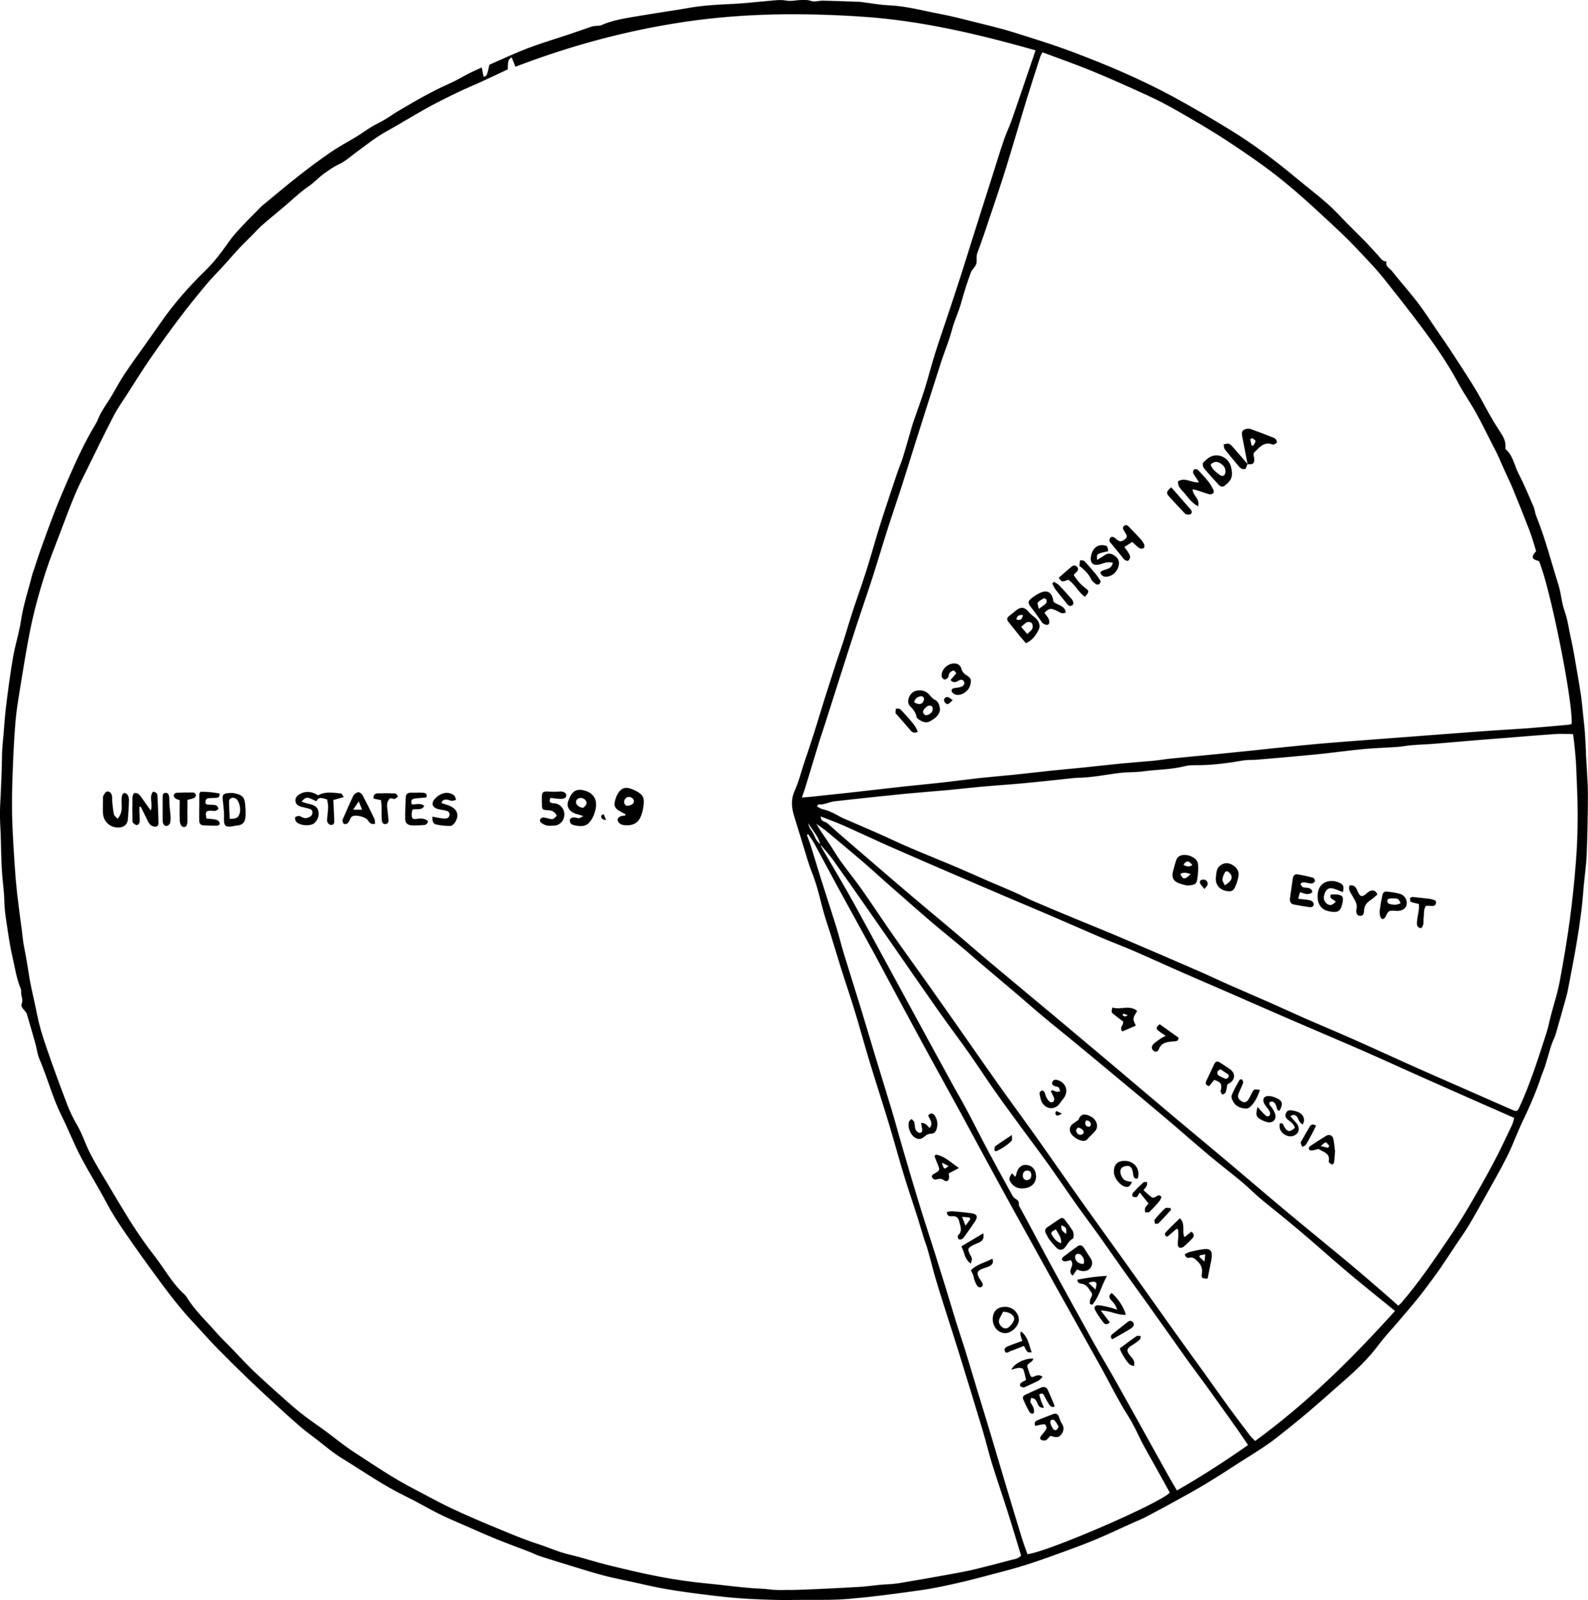
Pie Chart is a type of graph, which has sections in each section of the circle. It represents ''Proportion of World's Supply of Cotton contributed by each country", vintage line drawing or engraving illustration.