forex stock market Royalty Free Vector Images (898)
Page 8 of 18

Abstract financial ascending linear graph. Stock Vector illustration isolated on white background.
VectorUsername
KyrylovResolution
3793x2000pxAbstract financial ascending linear graph. Stock Vector illustration isolated on white background.


A man stands near the smartphone, on the screen Stocks market graph. Trading, forex. Excellent investing.
VectorUsername
Vector-UpResolution
7147x4722pxA man stands near the smartphone, on the screen Stocks market graph. Trading, forex. Excellent investing.


A woman stands near the smartphone, on the screen Stocks market graph. Trading, forex. Excellent investing.
VectorUsername
Vector-UpResolution
6689x4722pxA woman stands near the smartphone, on the screen Stocks market graph. Trading, forex. Excellent investing.


Market indicators and solutions, global web support set, tiny people work with data flow
VectorUsername
LembergvectorResolution
8778x5000pxMarket indicators and solutions, global web support set, tiny people work with data flow


Dollar sign financial chart with line graph stock market. vector isolated on white background.
VectorUsername
KyrylovResolution
6000x6000pxDollar sign financial chart with line graph stock market. vector isolated on white background.


businessman holding magnet attract to candlestick chart background, concept of stock market, vector illustration
VectorUsername
h-santimaResolution
5000x3519pxbusinessman holding magnet attract to candlestick chart background, concept of stock market, vector illustration


Take profit and graph Signal buy or sell Investor is taking profit form stock chart
VectorUsername
JulsIstResolution
6476x3861pxTake profit and graph Signal buy or sell Investor is taking profit form stock chart


Take profit and graph Signal buy or sell Investor is taking profit form stock chart
VectorUsername
JulsIstResolution
6476x3861pxTake profit and graph Signal buy or sell Investor is taking profit form stock chart


Take profit and graph Signal buy or sell Investor is taking profit form stock chart
VectorUsername
JulsIstResolution
6948x3598pxTake profit and graph Signal buy or sell Investor is taking profit form stock chart


Flat bot banner. Financial investment trade. Artificial intelligence. Mobile stock trading concept
VectorUsername
Vector-UpResolution
4723x4723pxFlat bot banner. Financial investment trade. Artificial intelligence. Mobile stock trading concept


Flat bot banner. Financial investment trade. Artificial intelligence. Mobile stock trading concept
VectorUsername
Vector-UpResolution
4723x4723pxFlat bot banner. Financial investment trade. Artificial intelligence. Mobile stock trading concept


Flat bot banner. Financial investment trade. Artificial intelligence. Mobile stock trading concept.
VectorUsername
Vector-UpResolution
6140x4723pxFlat bot banner. Financial investment trade. Artificial intelligence. Mobile stock trading concept.

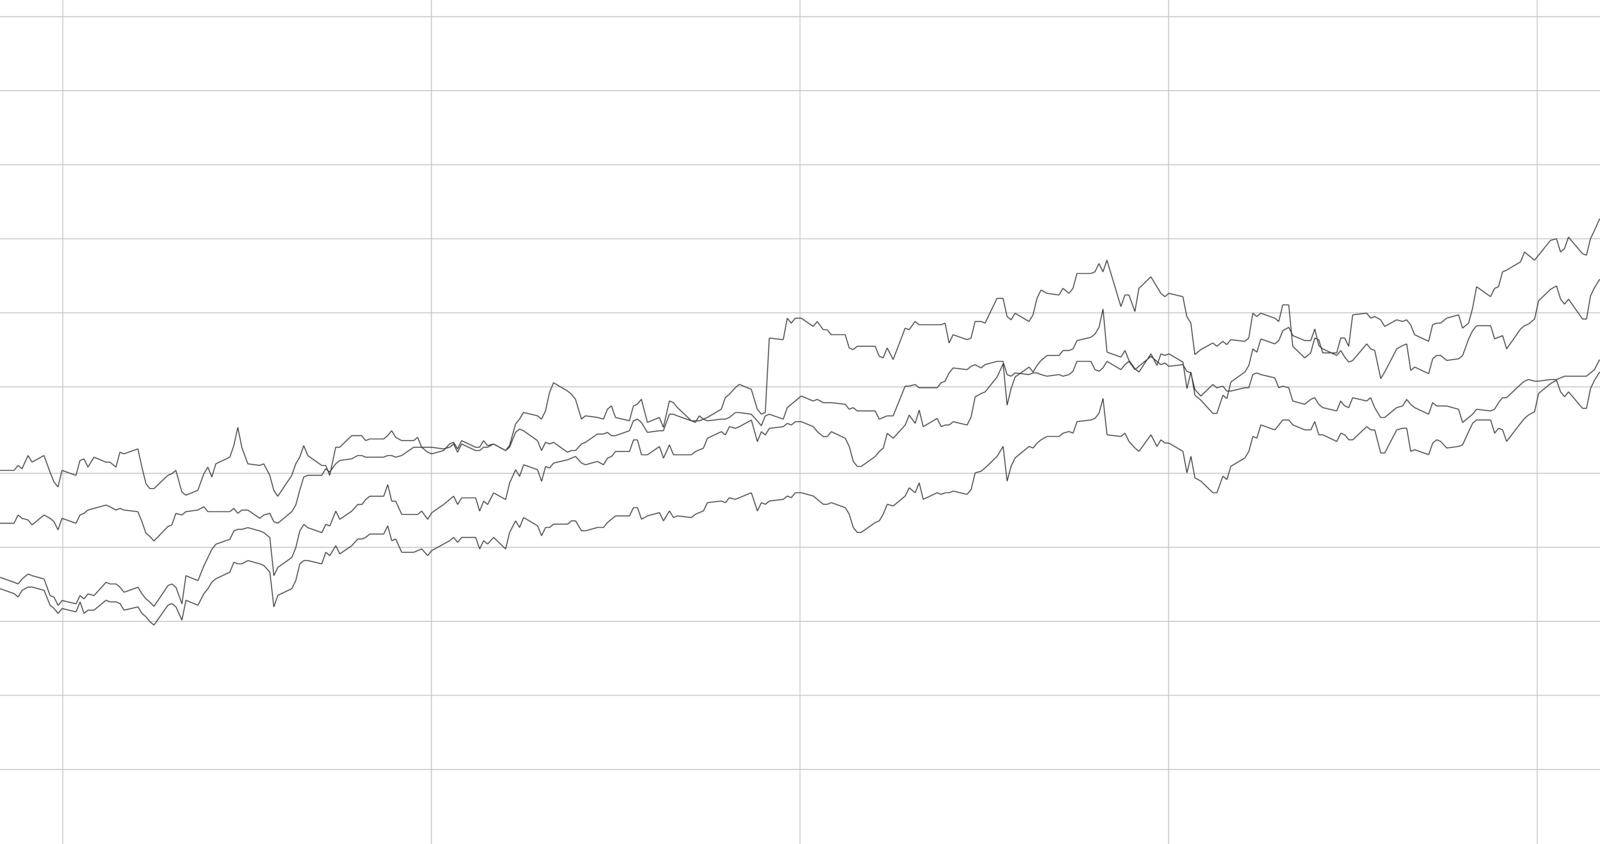
Economic graph with diagrams on the stock market, for business and financial concepts and reports. Abstract white vector background.
VectorUsername
KyrylovResolution
6000x3164pxEconomic graph with diagrams on the stock market, for business and financial concepts and reports. Abstract white vector background.
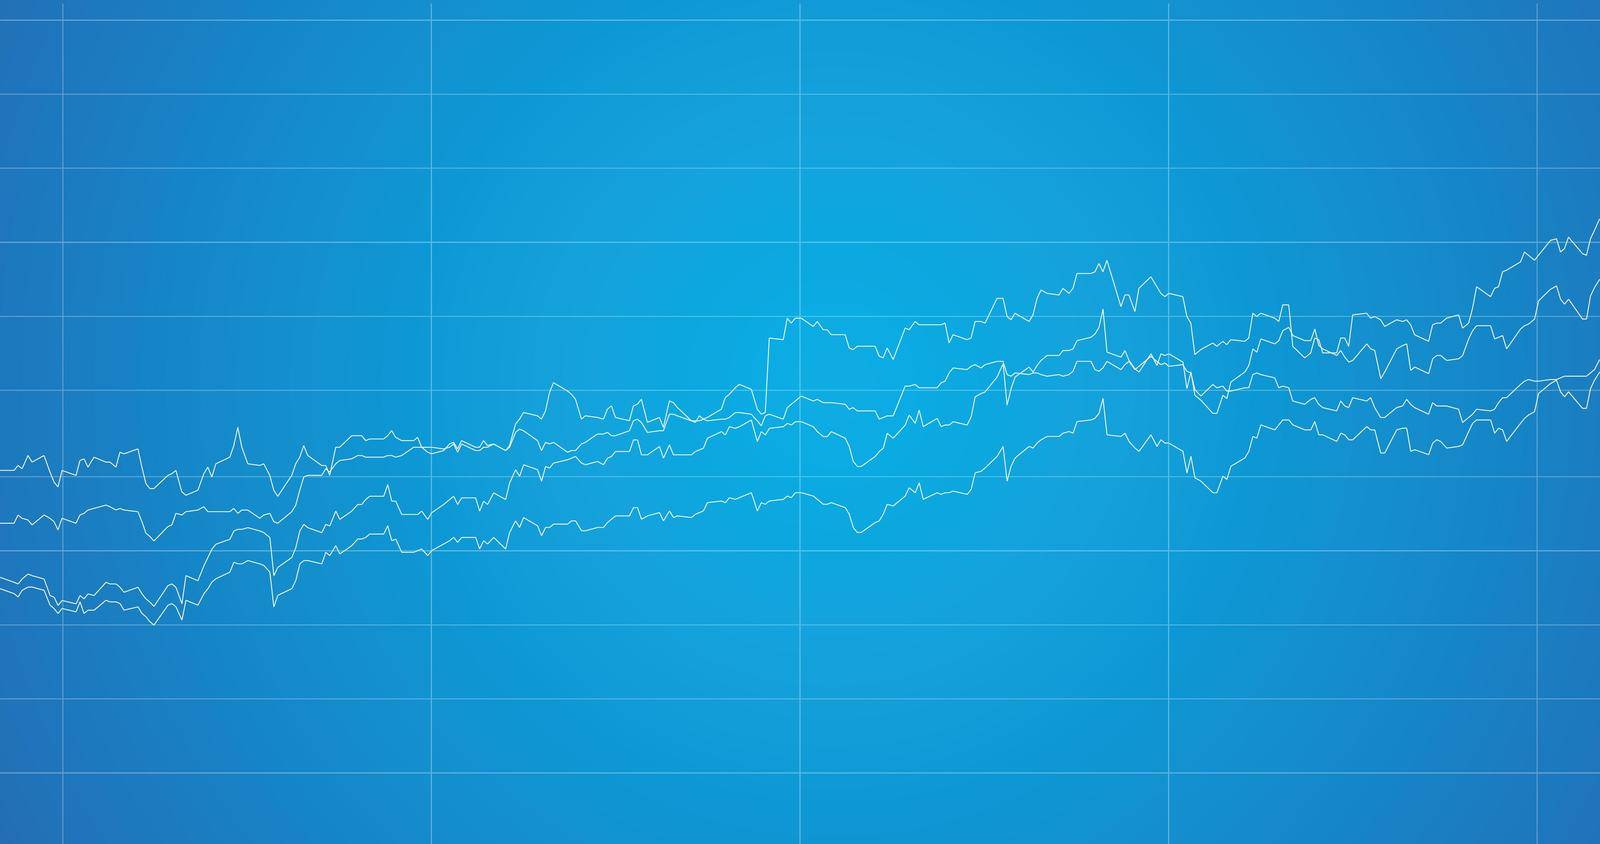
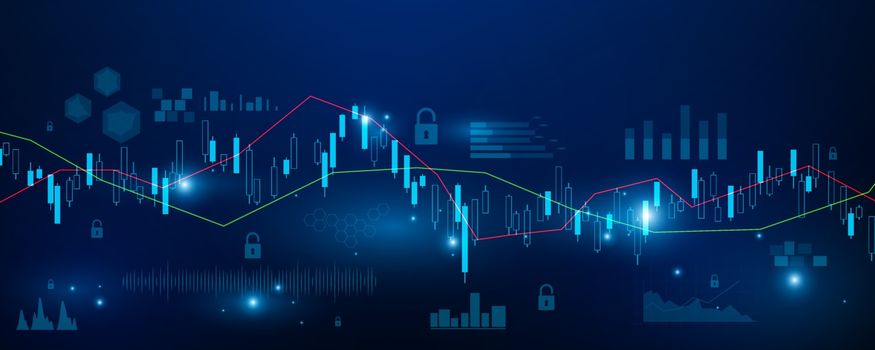
Economic graph with diagrams on the stock market, for business and financial concepts and reports. Abstract blue vector background.
VectorUsername
KyrylovResolution
6000x3164pxEconomic graph with diagrams on the stock market, for business and financial concepts and reports. Abstract blue vector background.

abstract financial chart. Different index arrows icon. Stock Vector illustration isolated on white background.
VectorUsername
ZhezheraResolution
6000x6000pxabstract financial chart. Different index arrows icon. Stock Vector illustration isolated on white background.


abstract financial chart. Different index arrows icon. Stock Vector illustration isolated on white background.
VectorUsername
ZhezheraResolution
6000x6000pxabstract financial chart. Different index arrows icon. Stock Vector illustration isolated on white background.

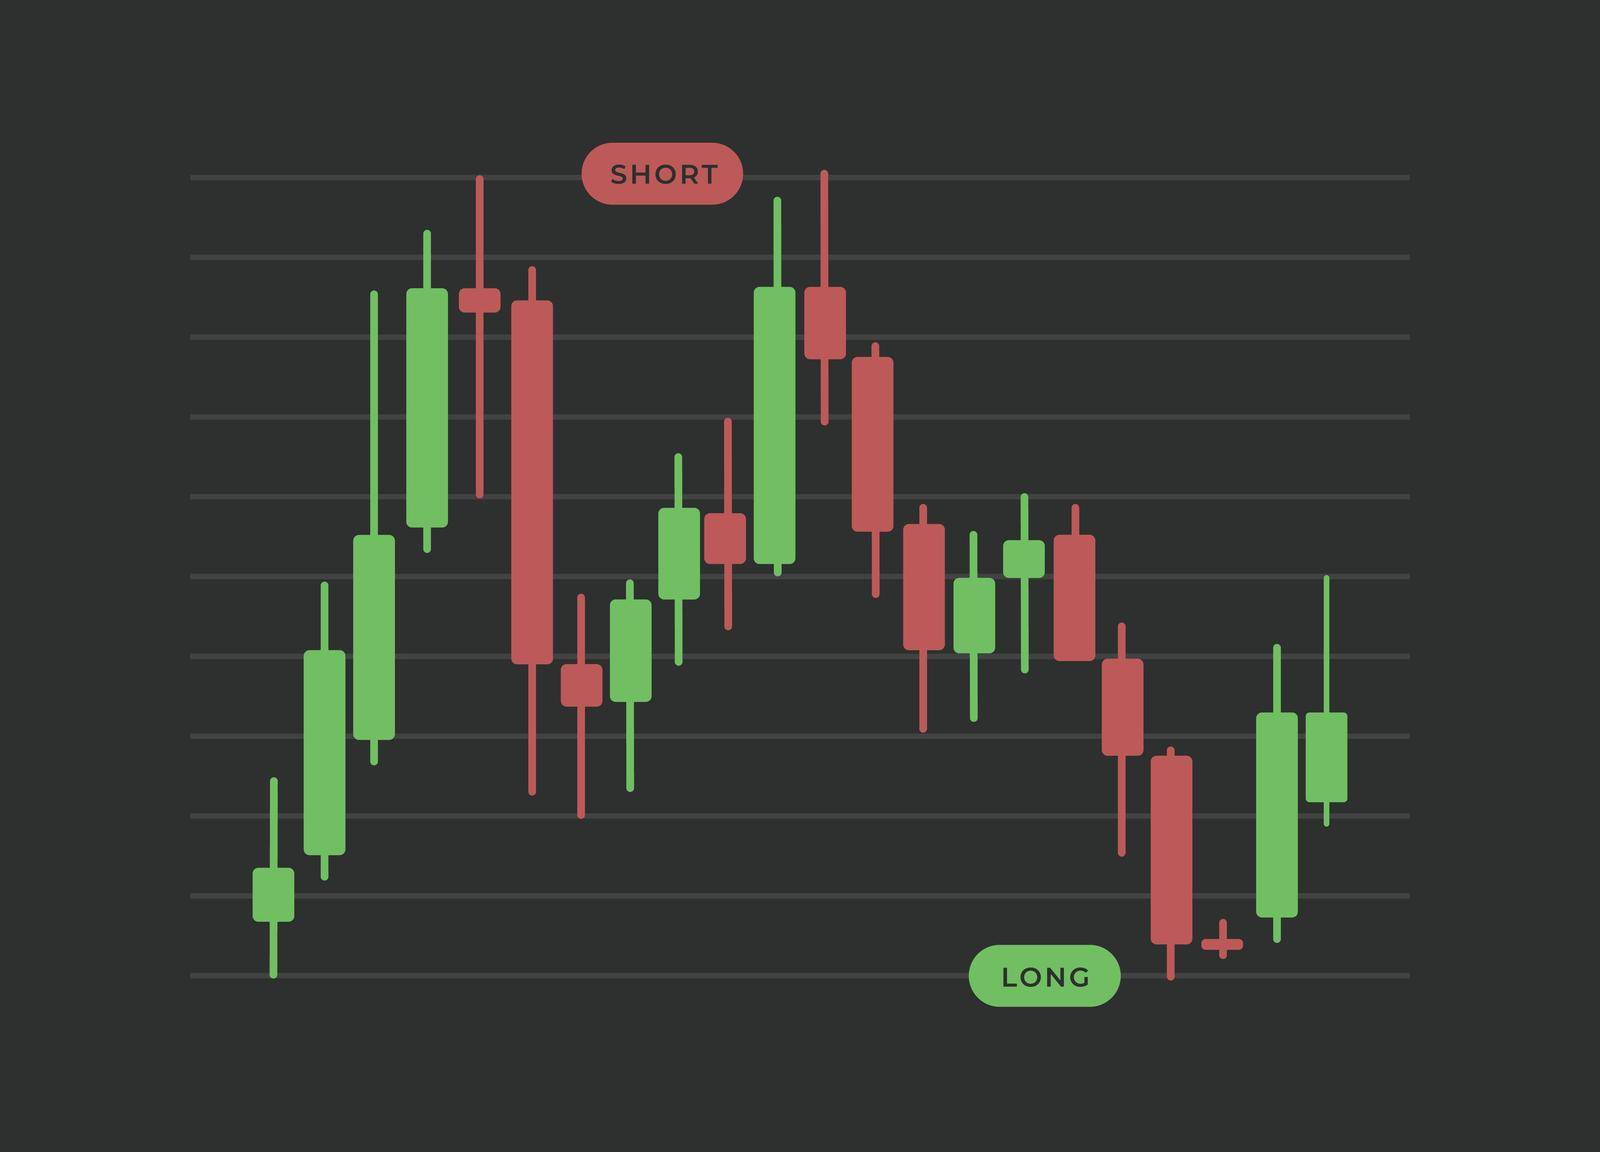
Long and Short Position with Margin Trading concept. Buy and Sell buttons with up and down arrows and price candles chart. Bull and Bear, Stock, crypto or forex currency exchange with green, red bars
VectorUsername
bestforbestResolution
5000x3600pxLong and Short Position with Margin Trading concept. Buy and Sell buttons with up and down arrows and price candles chart. Bull and Bear, Stock, crypto or forex currency exchange with green, red bars


Candle chart in forex trading, stock, mutual funds, commodity, currency. People see company performance to choose a issuer in mixed investment. Human illustration for website, mobile apps, poster
VectorUsername
yayimageResolution
7917x3854pxCandle chart in forex trading, stock, mutual funds, commodity, currency. People see company performance to choose a issuer in mixed investment. Human illustration for website, mobile apps, poster


Support and resistance levels in stock, forex, and cryptocurrency markets. Smartphone displaying a trend between parallel lines. Bull and bear market dynamics
VectorUsername
bestforbestResolution
5000x3500pxSupport and resistance levels in stock, forex, and cryptocurrency markets. Smartphone displaying a trend between parallel lines. Bull and bear market dynamics


Transfer and send money with application. trade between currencies. forex trading apps, concept vector ilustration. can use for landing page, template, ui, web, mobile app, poster, banner, flyer
VectorUsername
yayimageResolution
5556x4583pxTransfer and send money with application. trade between currencies. forex trading apps, concept vector ilustration. can use for landing page, template, ui, web, mobile app, poster, banner, flyer


Forex online trading, banking, investment Vector Illustration concept, people determine investment. Easy to use for website, banner, landing page, brochure, flyer, print, mobile, poster, template, UI
VectorUsername
yayimageResolution
5000x3125pxForex online trading, banking, investment Vector Illustration concept, people determine investment. Easy to use for website, banner, landing page, brochure, flyer, print, mobile, poster, template, UI

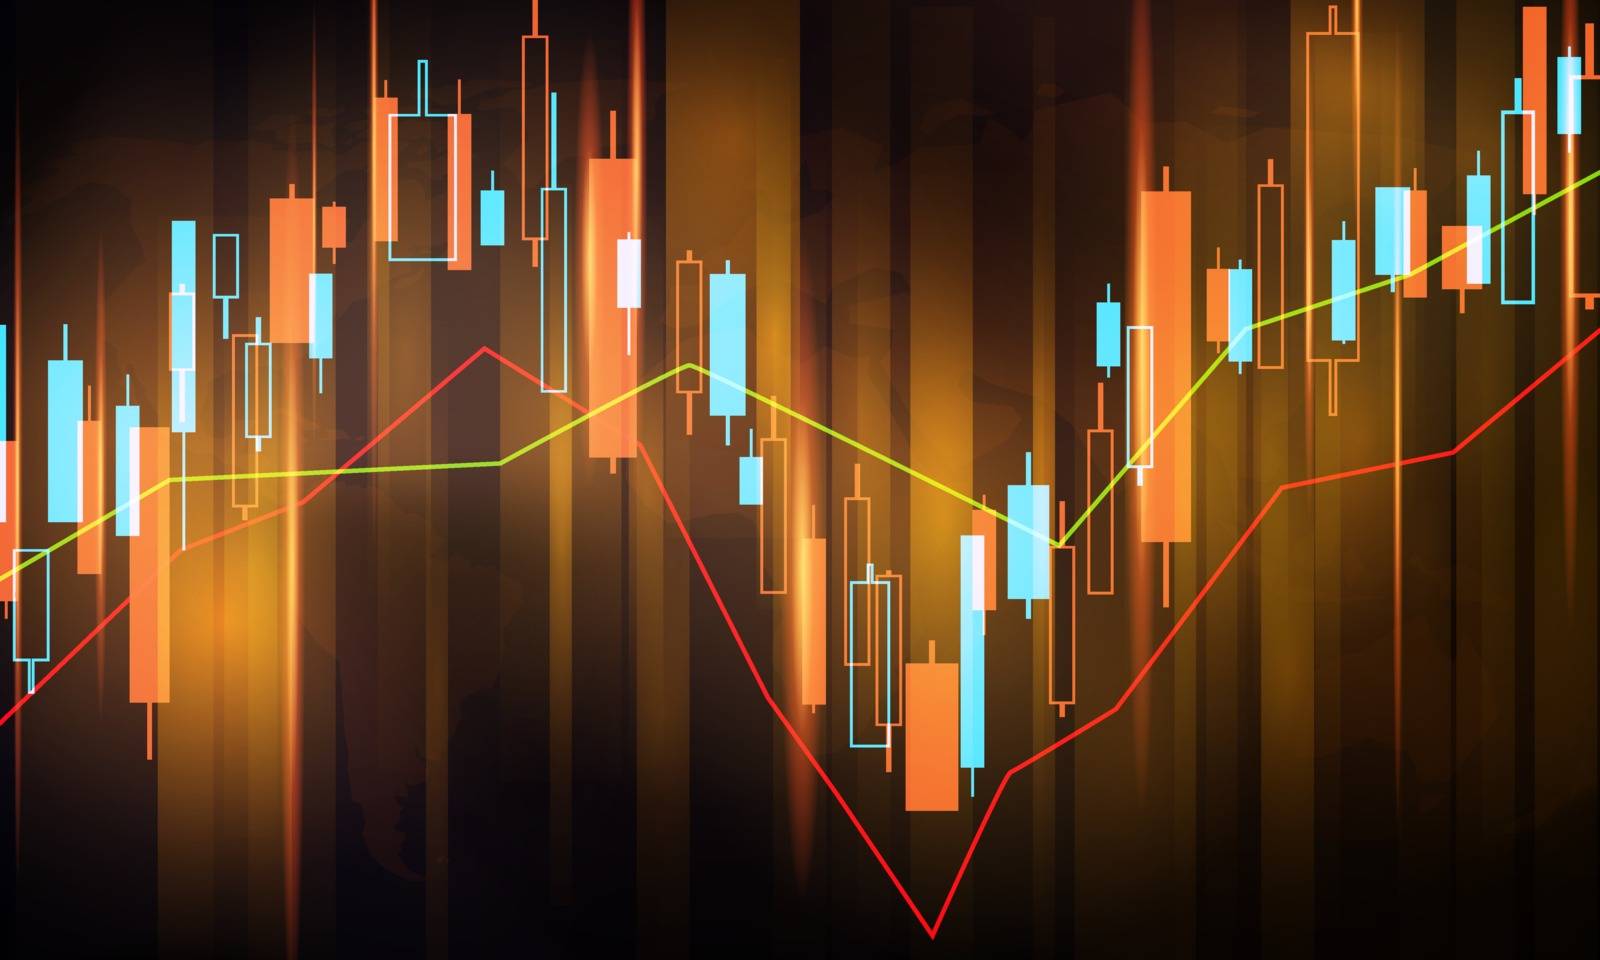
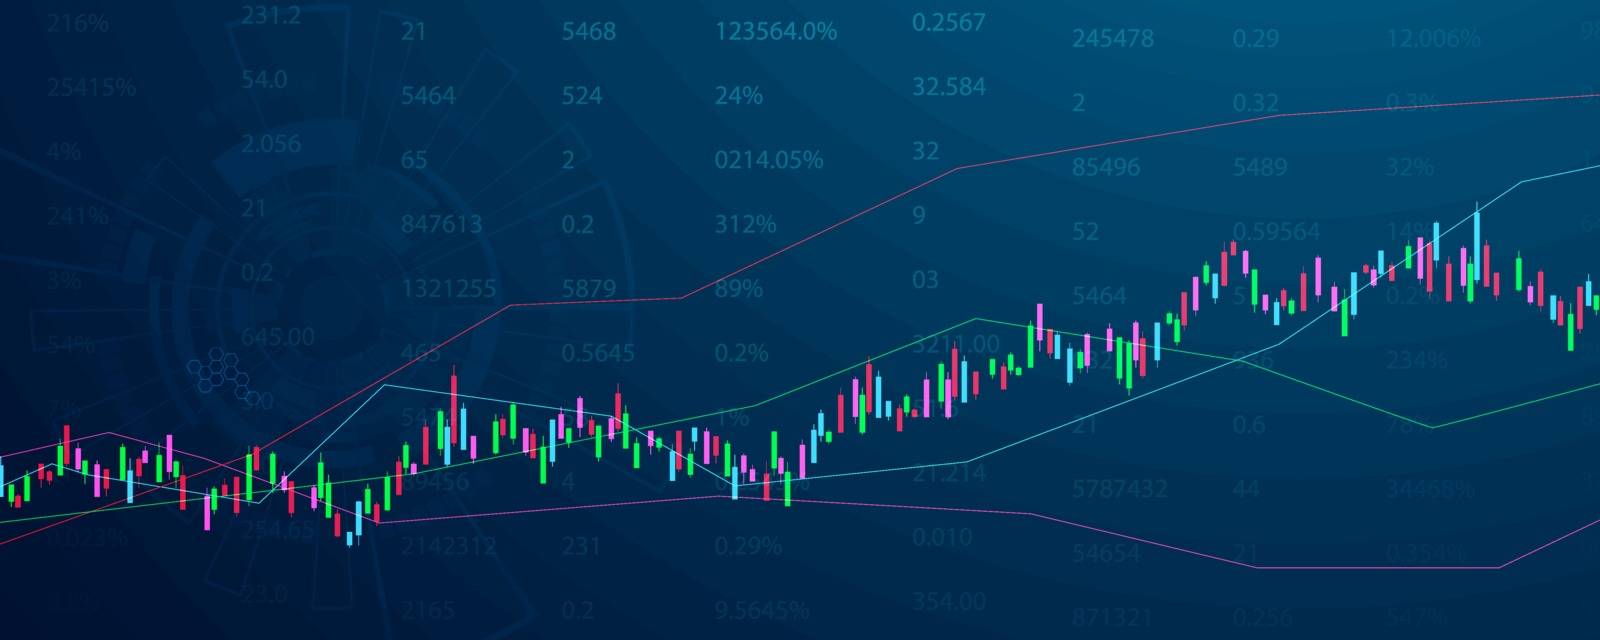
stock market, economic graph with diagrams, business and financial concepts and reports, abstract technology communication concept vector background
VectorUsername
supawatResolution
5000x3000pxstock market, economic graph with diagrams, business and financial concepts and reports, abstract technology communication concept vector background
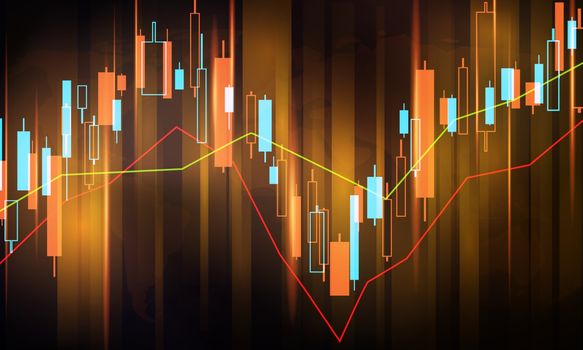

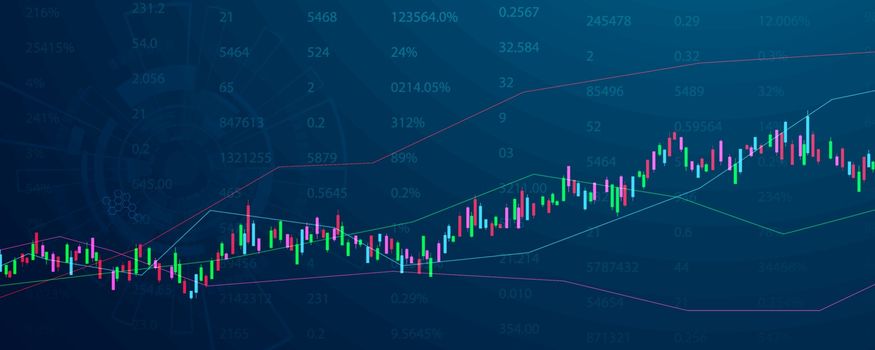
stock market, economic graph with diagrams, business and financial concepts and reports, abstract technology communication concept vector background
VectorUsername
supawatResolution
5000x2000pxstock market, economic graph with diagrams, business and financial concepts and reports, abstract technology communication concept vector background
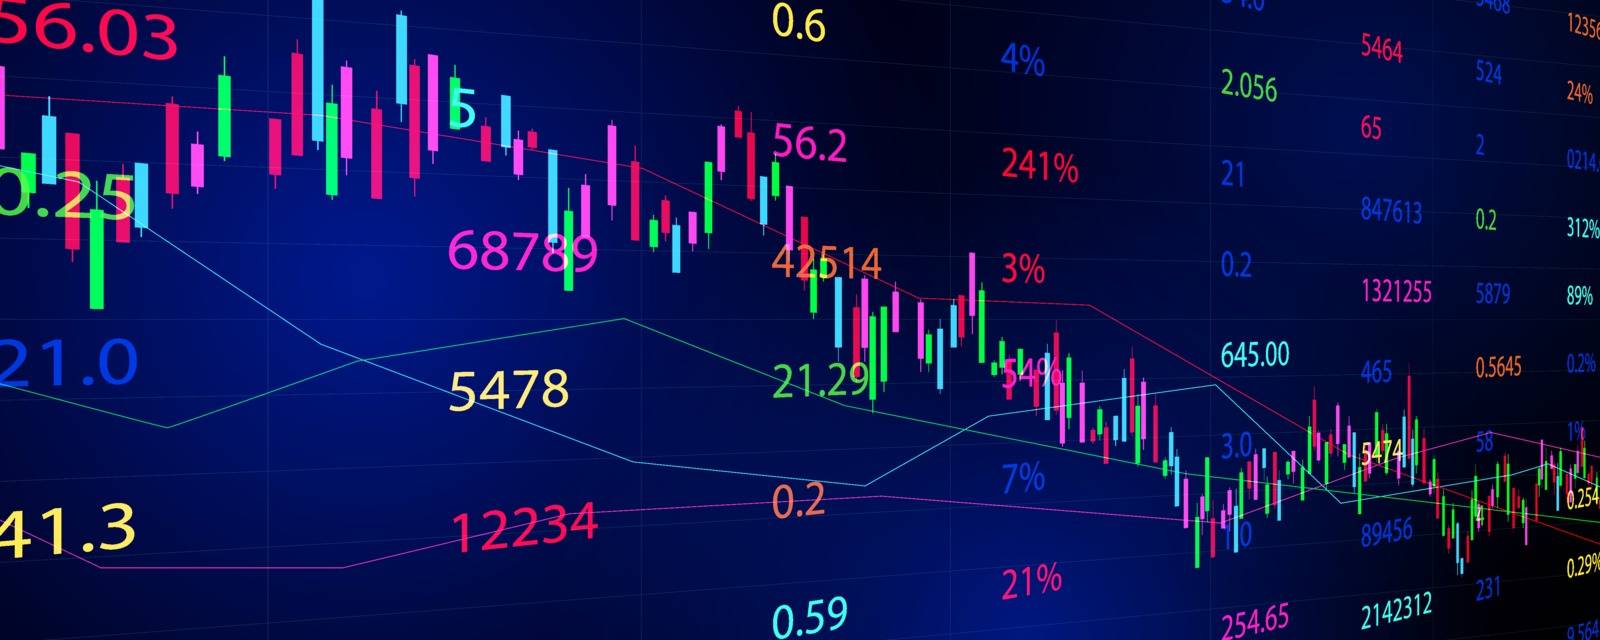
stock market, economic graph with diagrams, business and financial concepts and reports, abstract technology communication concept vector background
VectorUsername
supawatResolution
5000x3000pxstock market, economic graph with diagrams, business and financial concepts and reports, abstract technology communication concept vector background
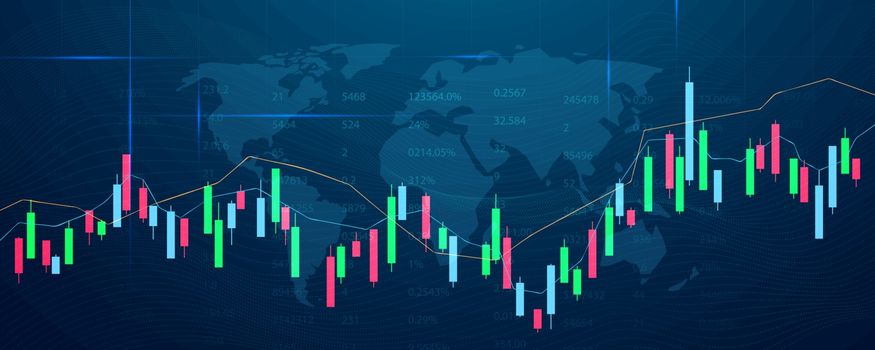
stock market, economic graph with diagrams, business and financial concepts and reports, abstract technology communication concept vector background
VectorUsername
supawatResolution
5000x2000pxstock market, economic graph with diagrams, business and financial concepts and reports, abstract technology communication concept vector background

RSI Relative Strength Index acronym Indicator technical analysis Cryptocurrency
VectorUsername
JulsIstResolution
6948x3598pxRSI Relative Strength Index acronym Indicator technical analysis Cryptocurrency

RSI Relative Strength Index acronym Indicator technical analysis Cryptocurrency
VectorUsername
JulsIstResolution
6948x3598pxRSI Relative Strength Index acronym Indicator technical analysis Cryptocurrency


Candlestick icon in linear style. financial graphic, investment profit trade. Stock vector illustration isolated on white background.
VectorUsername
KyrylovResolution
6000x6000pxCandlestick icon in linear style. financial graphic, investment profit trade. Stock vector illustration isolated on white background.


Futuristic blue rise up bar chart with arrow abstract technology background. Economy and financial concept. Stock money profit investment progress
VectorUsername
MiniStockerResolution
6000x3703pxFuturistic blue rise up bar chart with arrow abstract technology background. Economy and financial concept. Stock money profit investment progress


Stocks Market Graph Chart on Laptop Screen Linear Icon. Trading Platform and Trading Exchange Concept. Online Forex. Editable stroke. Vector illustration
VectorUsername
Toxa2x2Resolution
4000x4000pxStocks Market Graph Chart on Laptop Screen Linear Icon. Trading Platform and Trading Exchange Concept. Online Forex. Editable stroke. Vector illustration


Investment plan strategy to earn money, financial planning and stock, forex, crypto market analysis. Wealth management for profit. Businessman investor holding money coin with green candlesticks
VectorUsername
bestforbestResolution
5000x3600pxInvestment plan strategy to earn money, financial planning and stock, forex, crypto market analysis. Wealth management for profit. Businessman investor holding money coin with green candlesticks


Japanese trading chart with rising and falling candlesticks and RSI indicator, symbolizing use technical analysis in online stock, crypto trading and importance of monitoring market trends
VectorUsername
bestforbestResolution
5000x5000pxJapanese trading chart with rising and falling candlesticks and RSI indicator, symbolizing use technical analysis in online stock, crypto trading and importance of monitoring market trends


Falling Wedge chart pattern formation - bullish technical analysis reversal continuation trend figure. Descending and Ascending wedge in stock, forex, and cryptocurrency markets. Bull market dynamics
VectorUsername
bestforbestResolution
5000x3500pxFalling Wedge chart pattern formation - bullish technical analysis reversal continuation trend figure. Descending and Ascending wedge in stock, forex, and cryptocurrency markets. Bull market dynamics


Candlestick chart showing progress and growth of company
VectorUsername
pchvectorResolution
7000x5000pxCandlestick chart showing progress and growth of company


Candlestick chart showing progress and growth of company
VectorUsername
pchvectorResolution
7000x5000pxCandlestick chart showing progress and growth of company


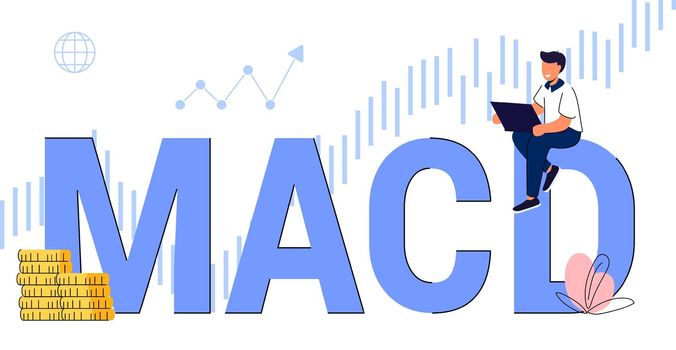
MACD Moving Average Convergence Divergence indicator technical analysis
VectorUsername
JulsIstResolution
6948x3598pxMACD Moving Average Convergence Divergence indicator technical analysis

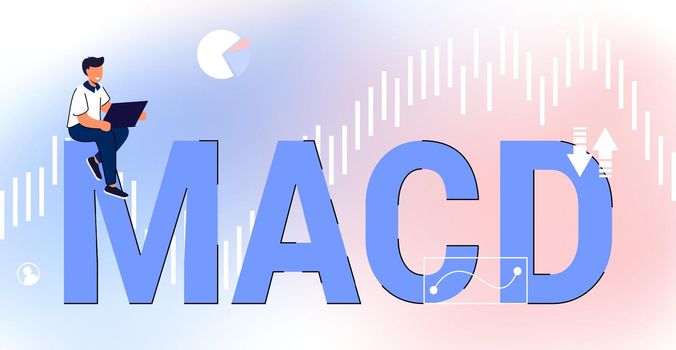
MACD Moving Average Convergence Divergence indicator technical analysis
VectorUsername
JulsIstResolution
6948x3598pxMACD Moving Average Convergence Divergence indicator technical analysis

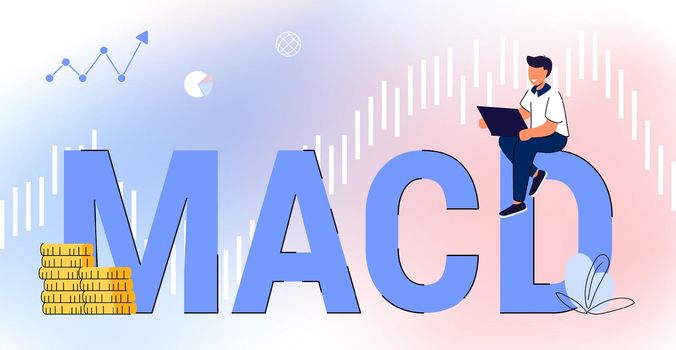
MACD Moving Average Convergence Divergence indicator technical analysis
VectorUsername
JulsIstResolution
6948x3598pxMACD Moving Average Convergence Divergence indicator technical analysis

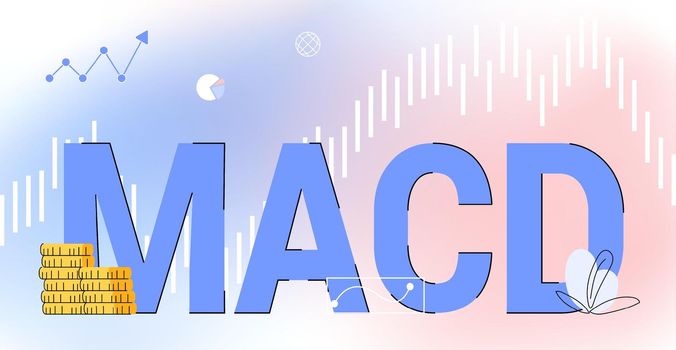
MACD Moving Average Convergence Divergence indicator technical analysis
VectorUsername
JulsIstResolution
6948x3598pxMACD Moving Average Convergence Divergence indicator technical analysis


MACD Moving Average Convergence Divergence indicator technical analysis
VectorUsername
JulsIstResolution
6948x3598pxMACD Moving Average Convergence Divergence indicator technical analysis

Rising Wedge chart pattern formation - bearish technical analysis reversal continuation trend figure. Descending and Ascending wedge in stock, forex, and cryptocurrency markets. Bear market dynamics
VectorUsername
bestforbestResolution
5000x3500pxRising Wedge chart pattern formation - bearish technical analysis reversal continuation trend figure. Descending and Ascending wedge in stock, forex, and cryptocurrency markets. Bear market dynamics
