forex trade Royalty Free Vector Images (805)
Page 9 of 17

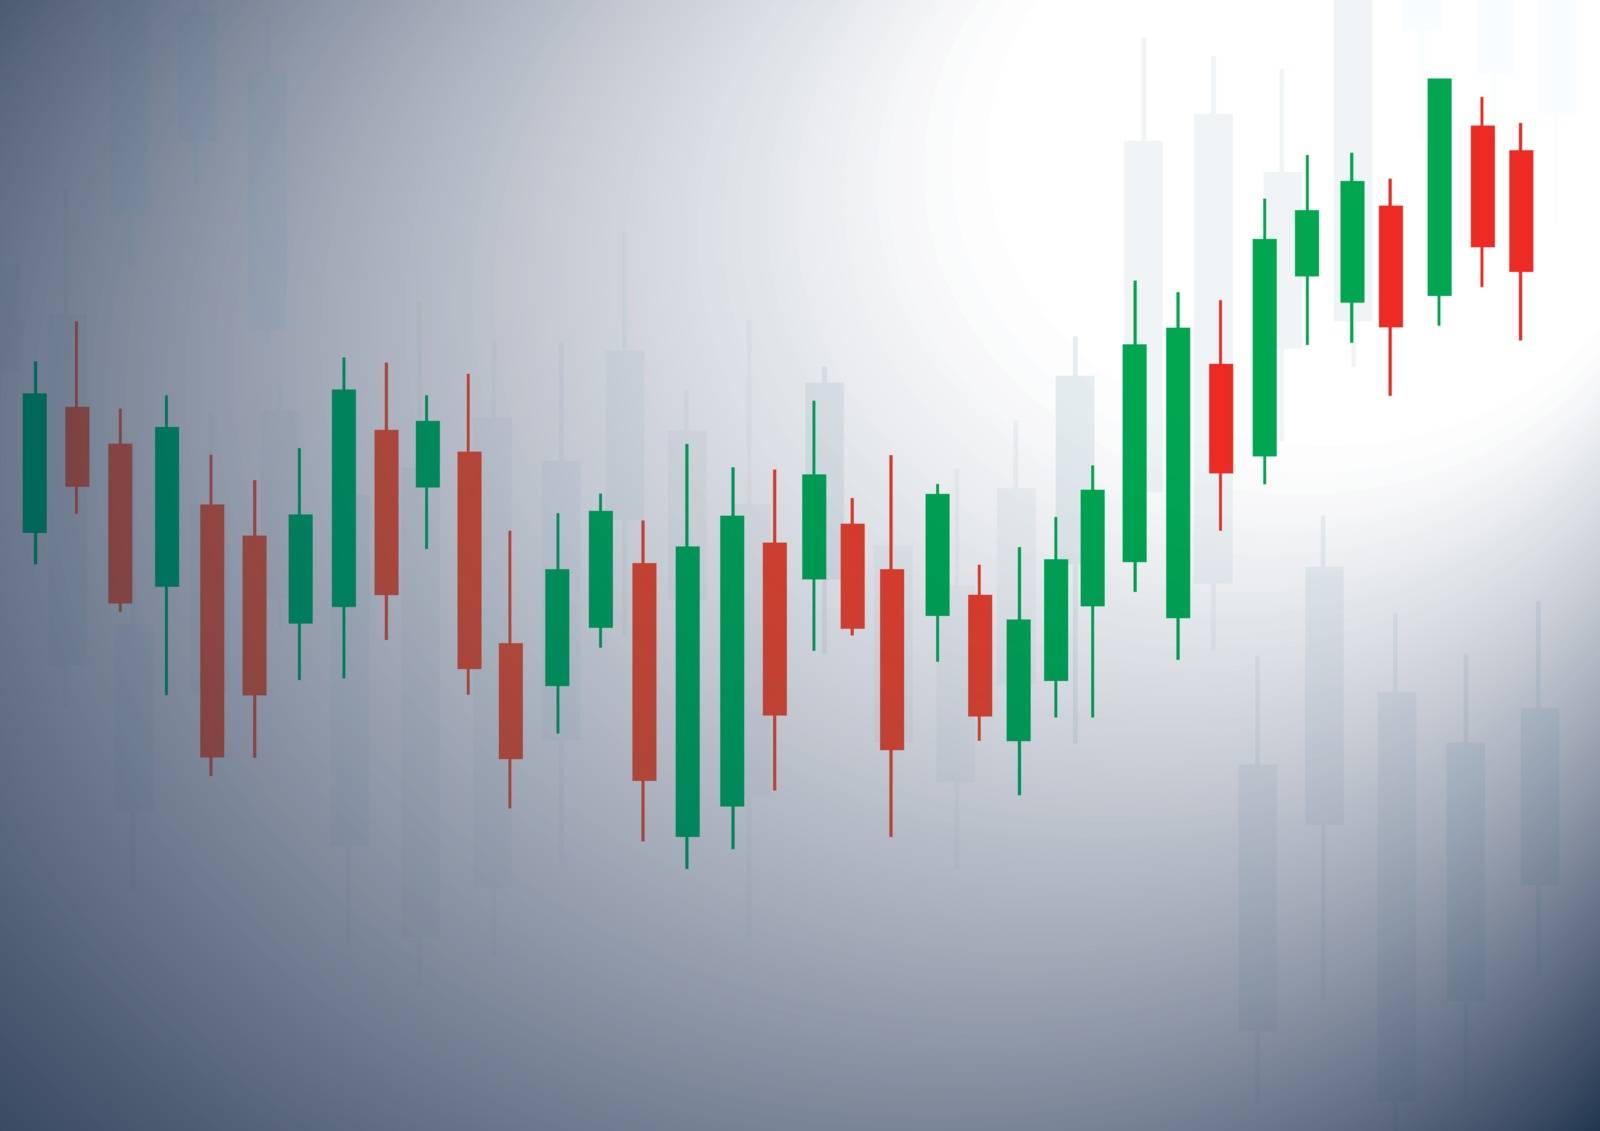
trading
VectorUsername
vectorstallResolution
2872x3477pxtrading


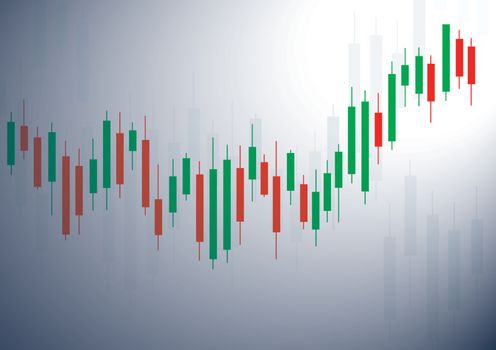
trading
VectorUsername
vectorstallResolution
2872x3477pxtrading


trading
VectorUsername
vectorstallResolution
2872x3476pxtrading


trading
VectorUsername
vectorstallResolution
3500x2974pxtrading

trading
VectorUsername
vectorstallResolution
2872x3476pxtrading


trading
VectorUsername
vectorstallResolution
3500x2974pxtrading


mobile
VectorUsername
vectorstallResolution
5000x5000pxmobile


mobile
VectorUsername
vectorstallResolution
5000x5000pxmobile


mobile
VectorUsername
vectorstallResolution
5000x5000pxmobile


mobile
VectorUsername
vectorstallResolution
5000x5000pxmobile


analytic
VectorUsername
FlaticonsDesignResolution
4167x4167pxanalytic


analytic
VectorUsername
FlaticonsDesignResolution
4167x4167pxanalytic


analytic
VectorUsername
FlaticonsDesignResolution
4167x4167pxanalytic


Stock Market Bulls and Bears Thin Line Vector Icon
VectorUsername
smokiResolution
5000x2679pxStock Market Bulls and Bears Thin Line Vector Icon


Stock Market Bulls and Bears Thin Line Vector Icon
VectorUsername
smokiResolution
5000x2679pxStock Market Bulls and Bears Thin Line Vector Icon


Abstract dollar money symbolize ball.
VectorUsername
narinbgResolution
4830x5000pxAbstract dollar money symbolize ball.


hand holding candlestick chart icon vector
VectorUsername
h-santimaResolution
5000x4827pxhand holding candlestick chart icon vector


hand holding candlestick chart icon vector
VectorUsername
h-santimaResolution
5000x3535pxhand holding candlestick chart icon vector


hand holding candlestick chart icon vector
VectorUsername
h-santimaResolution
5000x3535pxhand holding candlestick chart icon vector

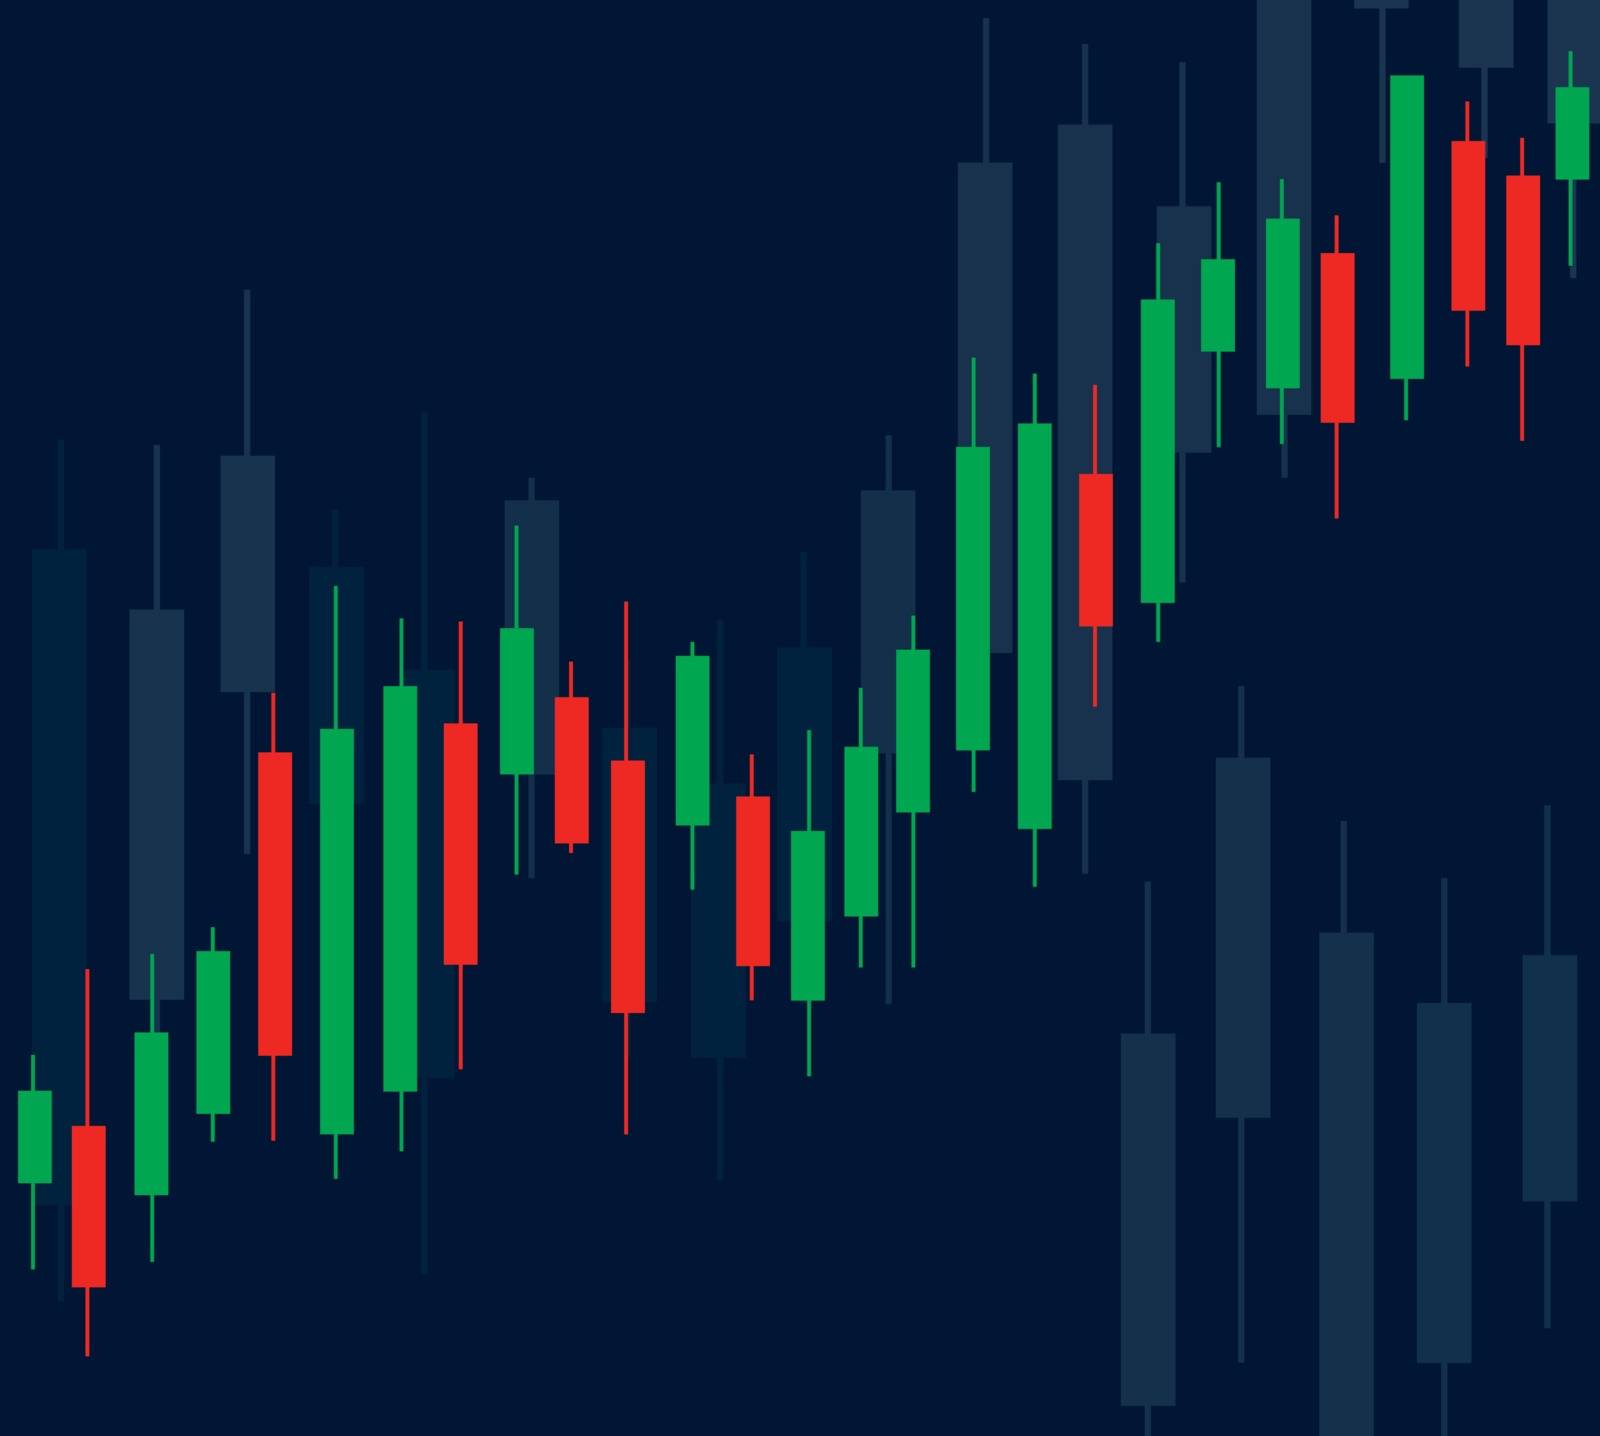
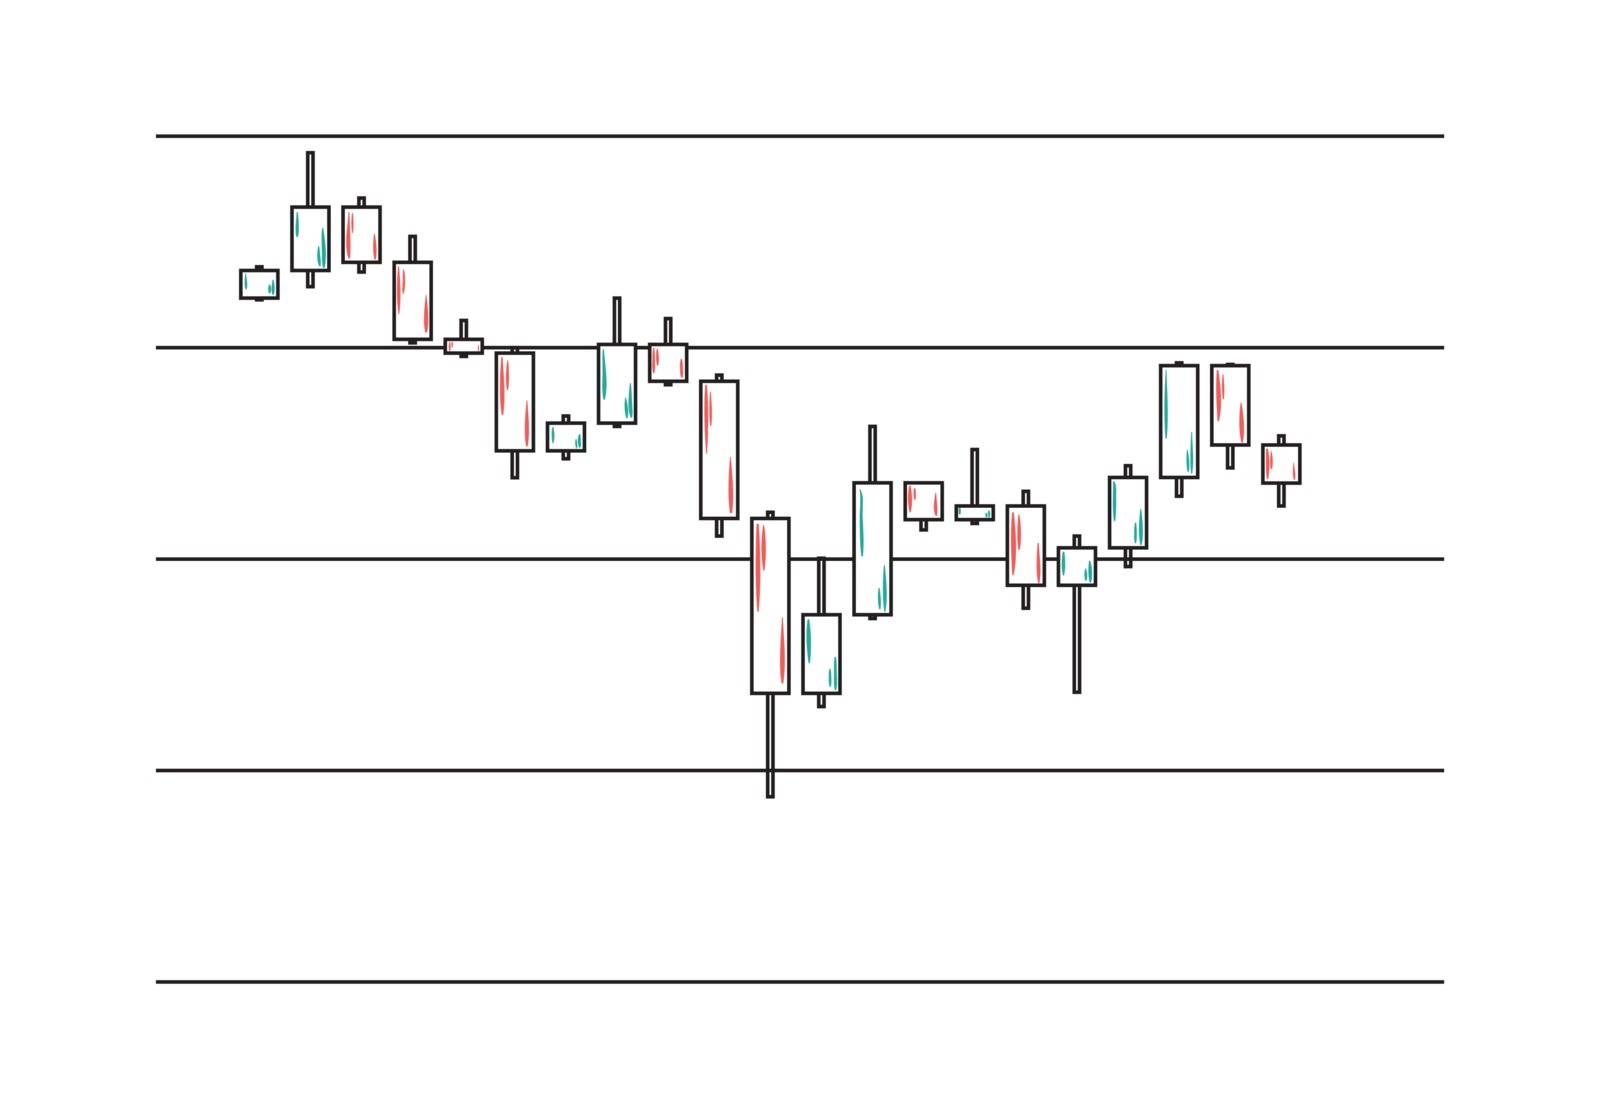
Candlestick stock exchange background vector
VectorUsername
h-santimaResolution
5000x4489pxCandlestick stock exchange background vector

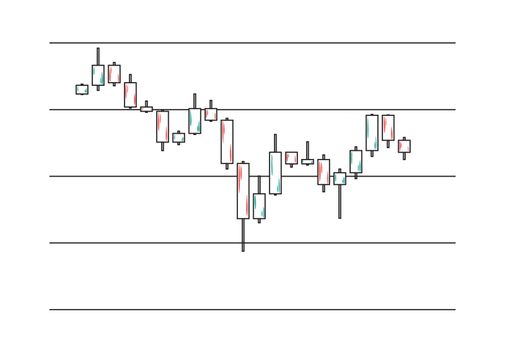
Candlestick stock exchange background vector
VectorUsername
h-santimaResolution
5000x4489pxCandlestick stock exchange background vector

Candlestick stock exchange background vector
VectorUsername
h-santimaResolution
5000x3535pxCandlestick stock exchange background vector

Candlestick stock exchange background vector
VectorUsername
h-santimaResolution
5000x3535pxCandlestick stock exchange background vector

Falling Wedge chart pattern formation - bullish technical analysis reversal continuation trend figure. Descending and Ascending wedge in stock, forex, and cryptocurrency markets. Bull market dynamics
VectorUsername
bestforbestResolution
5000x3500pxFalling Wedge chart pattern formation - bullish technical analysis reversal continuation trend figure. Descending and Ascending wedge in stock, forex, and cryptocurrency markets. Bull market dynamics


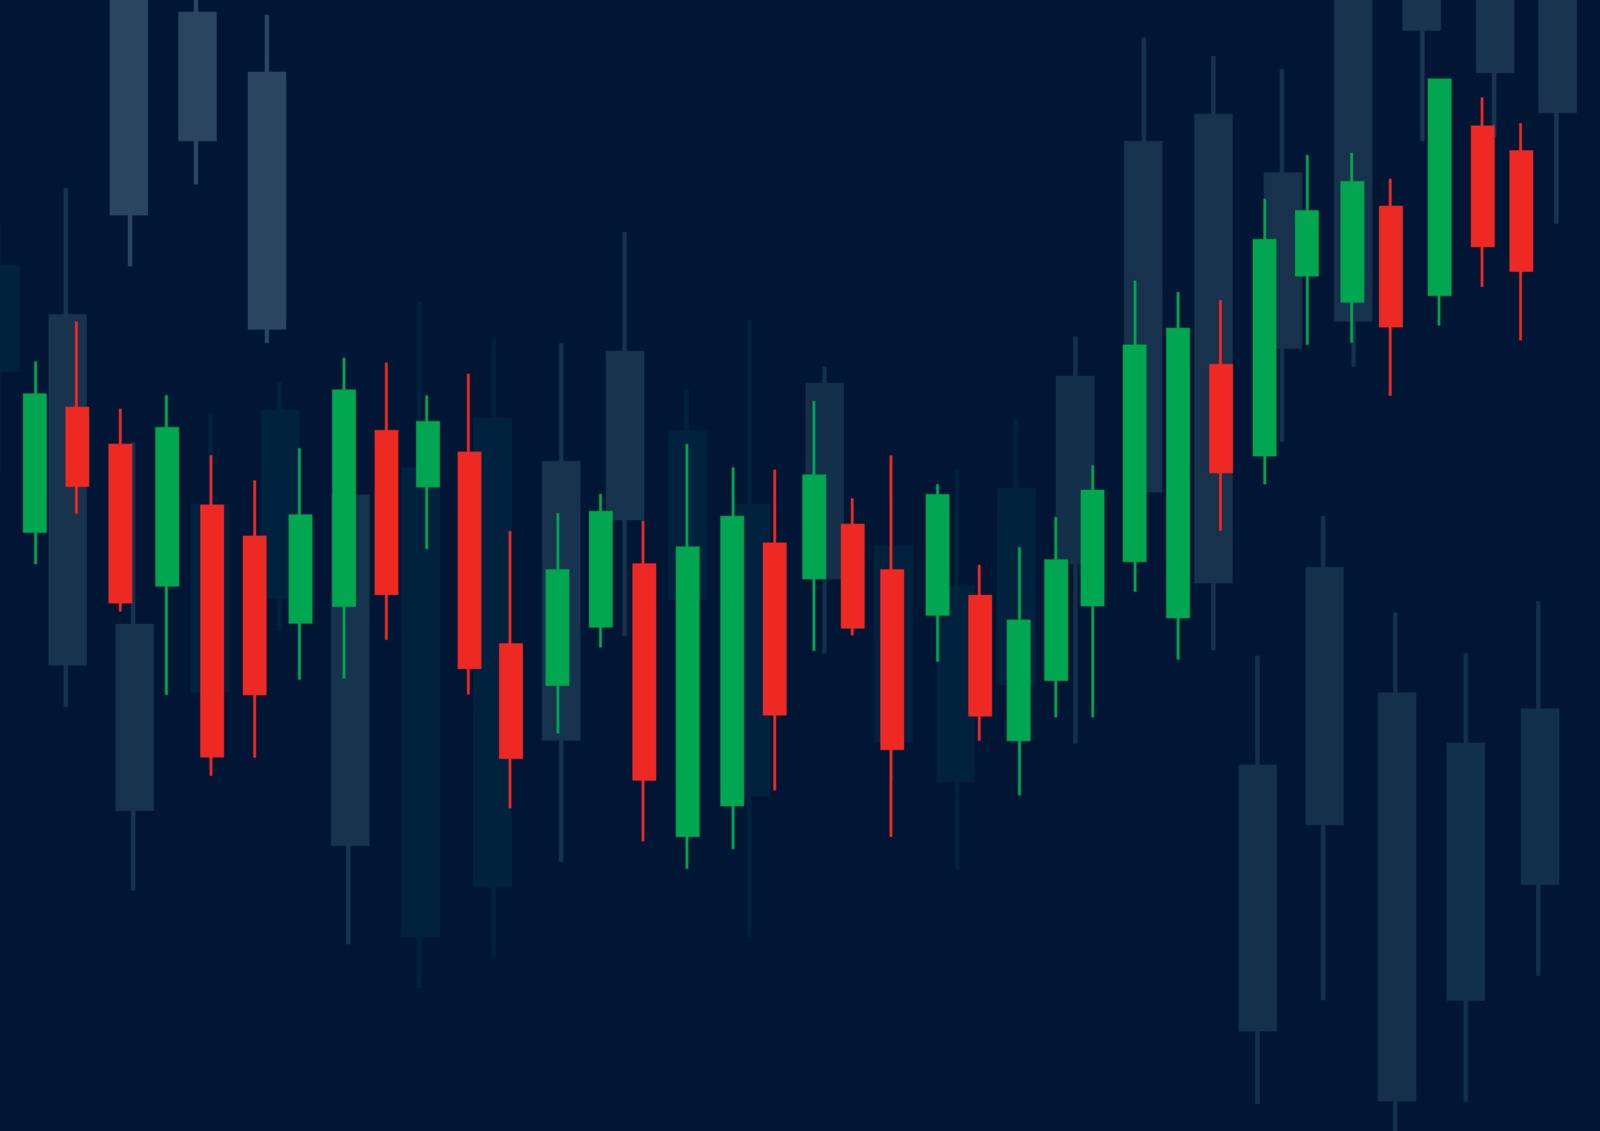
Candlestick stock exchange background vector
VectorUsername
h-santimaResolution
5000x4902pxCandlestick stock exchange background vector


Candlestick stock exchange background vector
VectorUsername
h-santimaResolution
5000x3535pxCandlestick stock exchange background vector


abstract candlestick stock exchange banner background vector
VectorUsername
h-santimaResolution
5000x4902pxabstract candlestick stock exchange banner background vector


Candlestick stock exchange background vector
VectorUsername
h-santimaResolution
5000x4902pxCandlestick stock exchange background vector


Candlestick stock exchange background vector
VectorUsername
h-santimaResolution
5000x3535pxCandlestick stock exchange background vector


Candlestick stock exchange background vector
VectorUsername
h-santimaResolution
5000x3535pxCandlestick stock exchange background vector


Candlestick stock exchange background vector
VectorUsername
h-santimaResolution
5000x3535pxCandlestick stock exchange background vector


Candlestick stock exchange background vector
VectorUsername
h-santimaResolution
5000x4489pxCandlestick stock exchange background vector


Candlestick stock exchange background vector
VectorUsername
h-santimaResolution
5000x3535pxCandlestick stock exchange background vector


Trading graph, financial business graph chart analysis backgroun
VectorUsername
NokkieVectorResolution
5000x2812pxTrading graph, financial business graph chart analysis backgroun


Trading graph, financial business graph chart analysis backgroun
VectorUsername
NokkieVectorResolution
5000x2813pxTrading graph, financial business graph chart analysis backgroun

candlestick chart in financial market
VectorUsername
muuraaResolution
5000x3469pxcandlestick chart in financial market
candlestick chart in financial market
VectorUsername
muuraaResolution
5000x3469pxcandlestick chart in financial market

currency symbols
VectorUsername
mtkangResolution
5000x4141pxcurrency symbols


Rising Wedge chart pattern formation - bearish technical analysis reversal continuation trend figure. Descending and Ascending wedge in stock, forex, and cryptocurrency markets. Bear market dynamics
VectorUsername
bestforbestResolution
5000x3500pxRising Wedge chart pattern formation - bearish technical analysis reversal continuation trend figure. Descending and Ascending wedge in stock, forex, and cryptocurrency markets. Bear market dynamics

Stock Market Crash icon. Monochrome simple line Economic Crisis icon for templates, web design and infographics
VectorUsername
simakovavectorResolution
5000x5000pxStock Market Crash icon. Monochrome simple line Economic Crisis icon for templates, web design and infographics
Stock Market Crash icon. Monochrome simple line Economic Crisis icon for templates, web design and infographics
VectorUsername
simakovavectorResolution
5000x5000pxStock Market Crash icon. Monochrome simple line Economic Crisis icon for templates, web design and infographics

Candle stick graph chart of stock market
VectorUsername
siraanamwongResolution
5000x5000pxCandle stick graph chart of stock market

Candlestick stock exchange blue background vector
VectorUsername
h-santimaResolution
5000x3537pxCandlestick stock exchange blue background vector


hexagon and candlestick stock exchange background vector
VectorUsername
h-santimaResolution
5000x3324pxhexagon and candlestick stock exchange background vector


hexagon and candlestick stock exchange background vector
VectorUsername
h-santimaResolution
5000x3324pxhexagon and candlestick stock exchange background vector


hexagon and candlestick stock exchange background vector
VectorUsername
h-santimaResolution
5000x3324pxhexagon and candlestick stock exchange background vector


hexagon and candlestick stock exchange background vector
VectorUsername
h-santimaResolution
5000x3324pxhexagon and candlestick stock exchange background vector


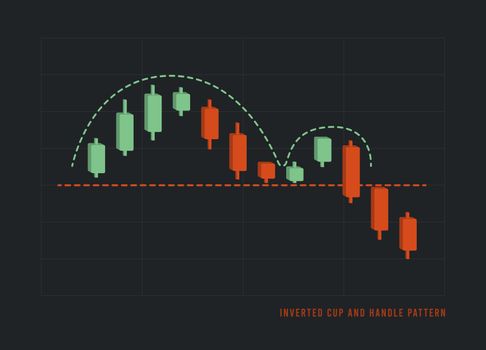
Inverted Cup and Handle Pattern - bearish technical analysis continuation trend chart figure. Stock, cryptocurrency, forex, trading market price breakout vector illustration with black background
VectorUsername
bestforbestResolution
5000x3600pxInverted Cup and Handle Pattern - bearish technical analysis continuation trend chart figure. Stock, cryptocurrency, forex, trading market price breakout vector illustration with black background
Cryptocurrency Chart icon. Monochrome simple Cryptocurrency icon for templates, web design and infographics
VectorUsername
simakovavectorResolution
5000x5000pxCryptocurrency Chart icon. Monochrome simple Cryptocurrency icon for templates, web design and infographics

Cryptocurrency Deposit icon. Monochrome simple Cryptocurrency icon for templates, web design and infographics
VectorUsername
simakovavectorResolution
5000x5000pxCryptocurrency Deposit icon. Monochrome simple Cryptocurrency icon for templates, web design and infographics
