forex Royalty Free Vector Images (1,081)
Page 3 of 22
Stochastic Oscillator - stock market momentum indicator. Trade with confidence in forex and cryptocurrency. Vector illustration with black background
VectorUsername
bestforbestResolution
5000x3700pxStochastic Oscillator - stock market momentum indicator. Trade with confidence in forex and cryptocurrency. Vector illustration with black background

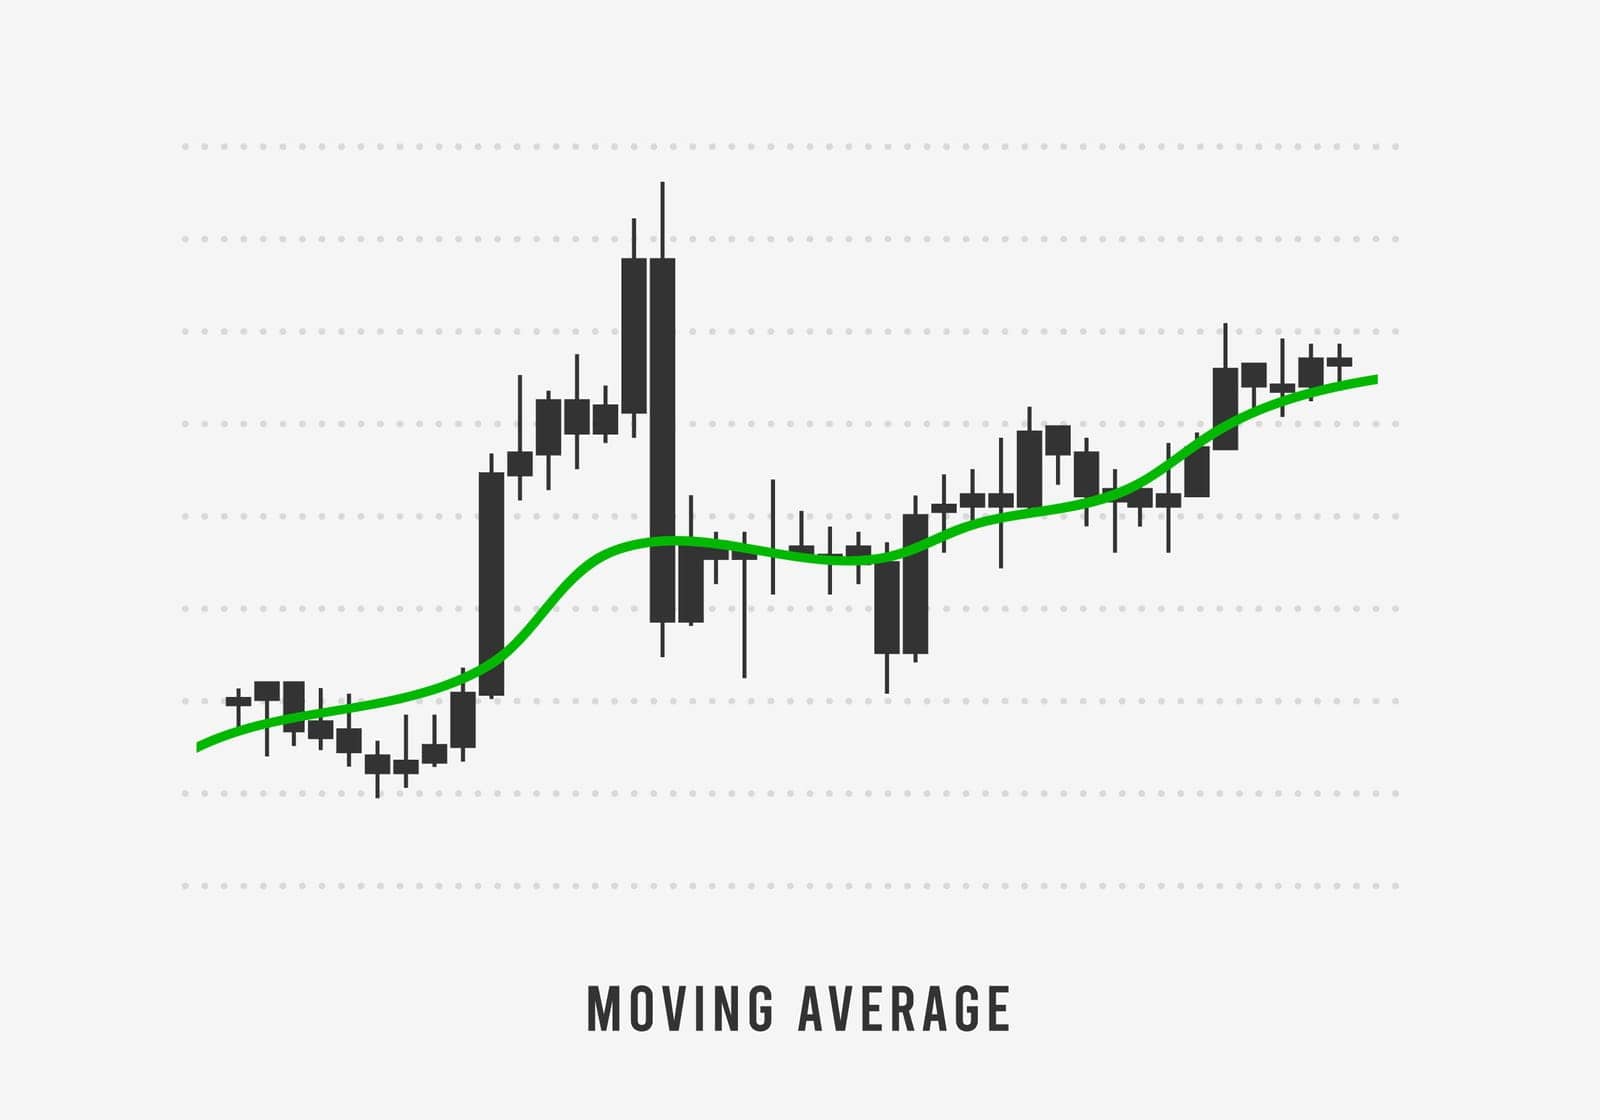
Moving Average indicator for technical analysis. Stock and cryptocurrency exchange graph. Forex analytics and trading market chart. Vector illustration
VectorUsername
bestforbestResolution
5000x3500pxMoving Average indicator for technical analysis. Stock and cryptocurrency exchange graph. Forex analytics and trading market chart. Vector illustration

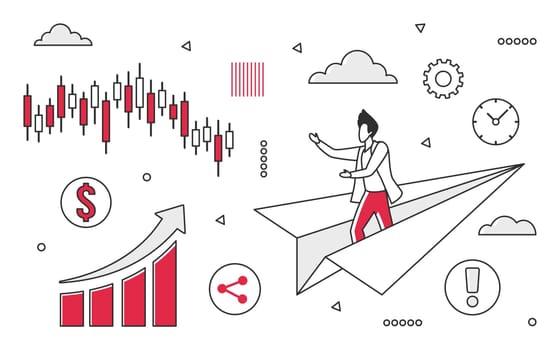
Forex stock and currency candlestick signal with color arrow bar graph. Business and investment indicator concept. Marketing and financial theme
VectorUsername
MiniStockerResolution
6000x3750pxForex stock and currency candlestick signal with color arrow bar graph. Business and investment indicator concept. Marketing and financial theme

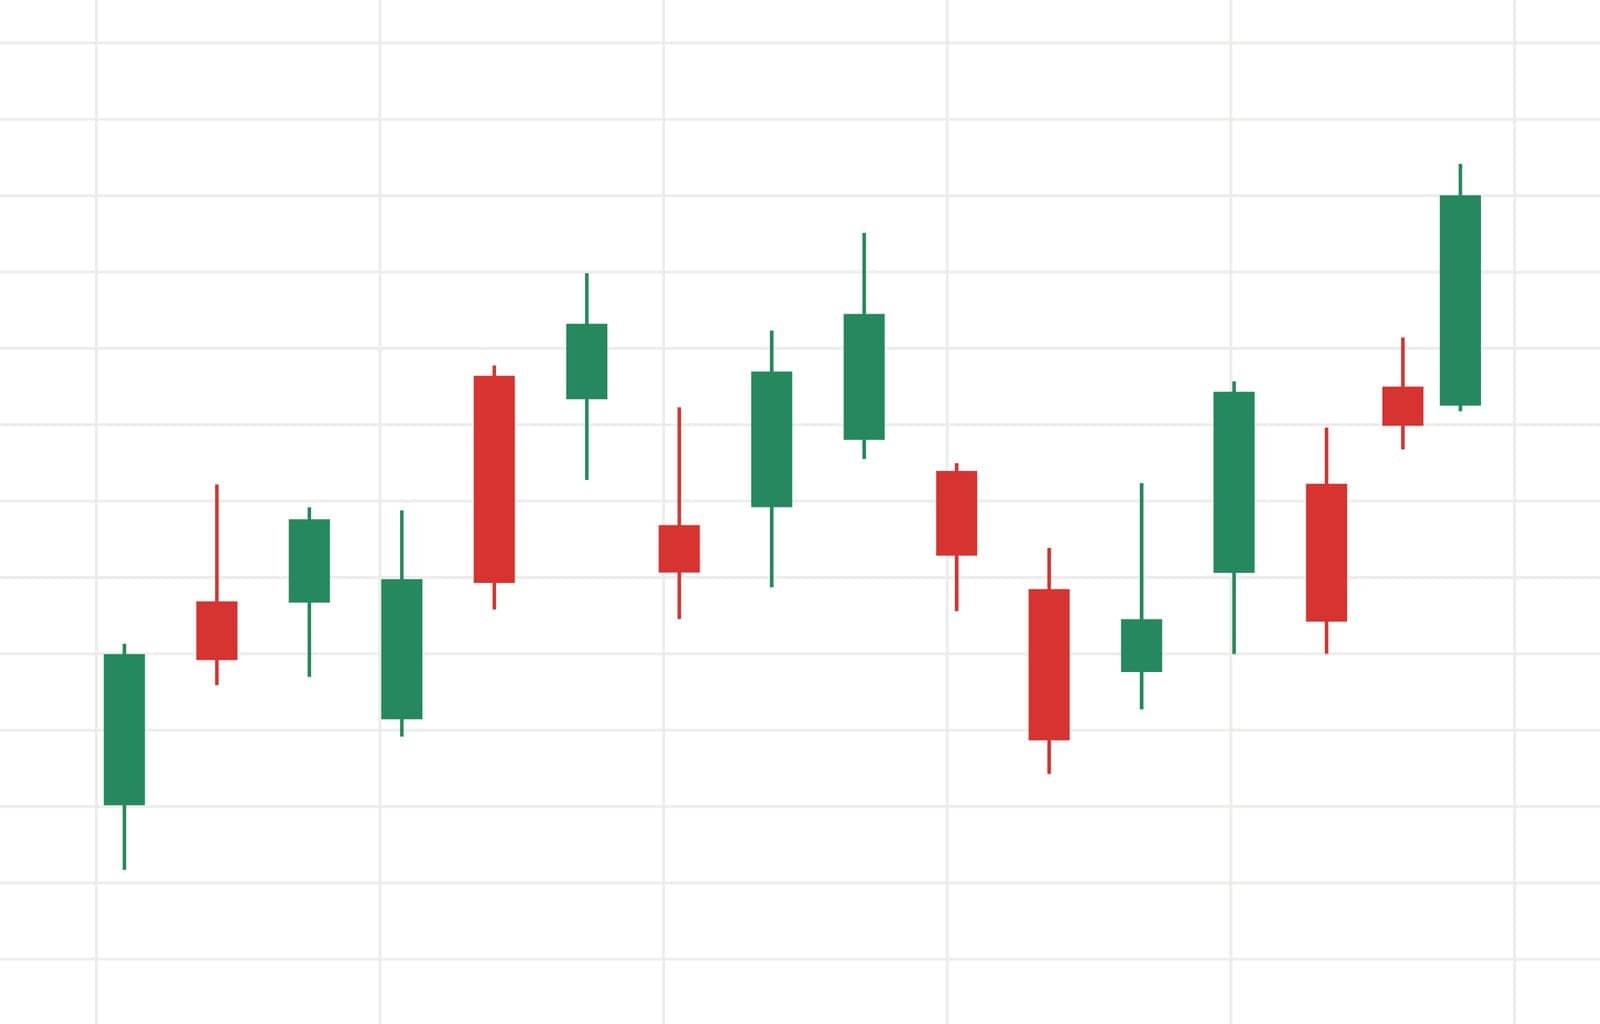
Forex Trading. Stock market candlestick, chart green and red japanese candle stick. Chart of buy and sell indicators vector illustration
VectorUsername
vikalostResolution
3745x1605pxForex Trading. Stock market candlestick, chart green and red japanese candle stick. Chart of buy and sell indicators vector illustration
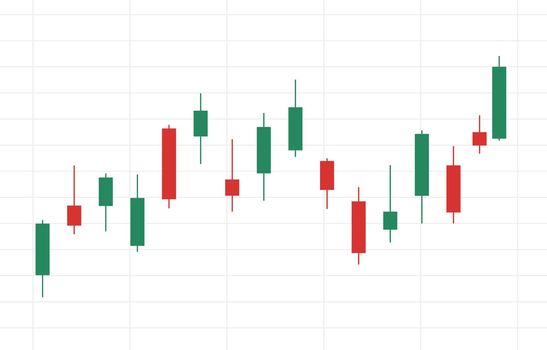
Forex Trading. Stock market candlestick, chart green and red japanese candle stick. Chart of buy and sell indicators vector illustration
VectorUsername
vikalostResolution
3075x1968pxForex Trading. Stock market candlestick, chart green and red japanese candle stick. Chart of buy and sell indicators vector illustration
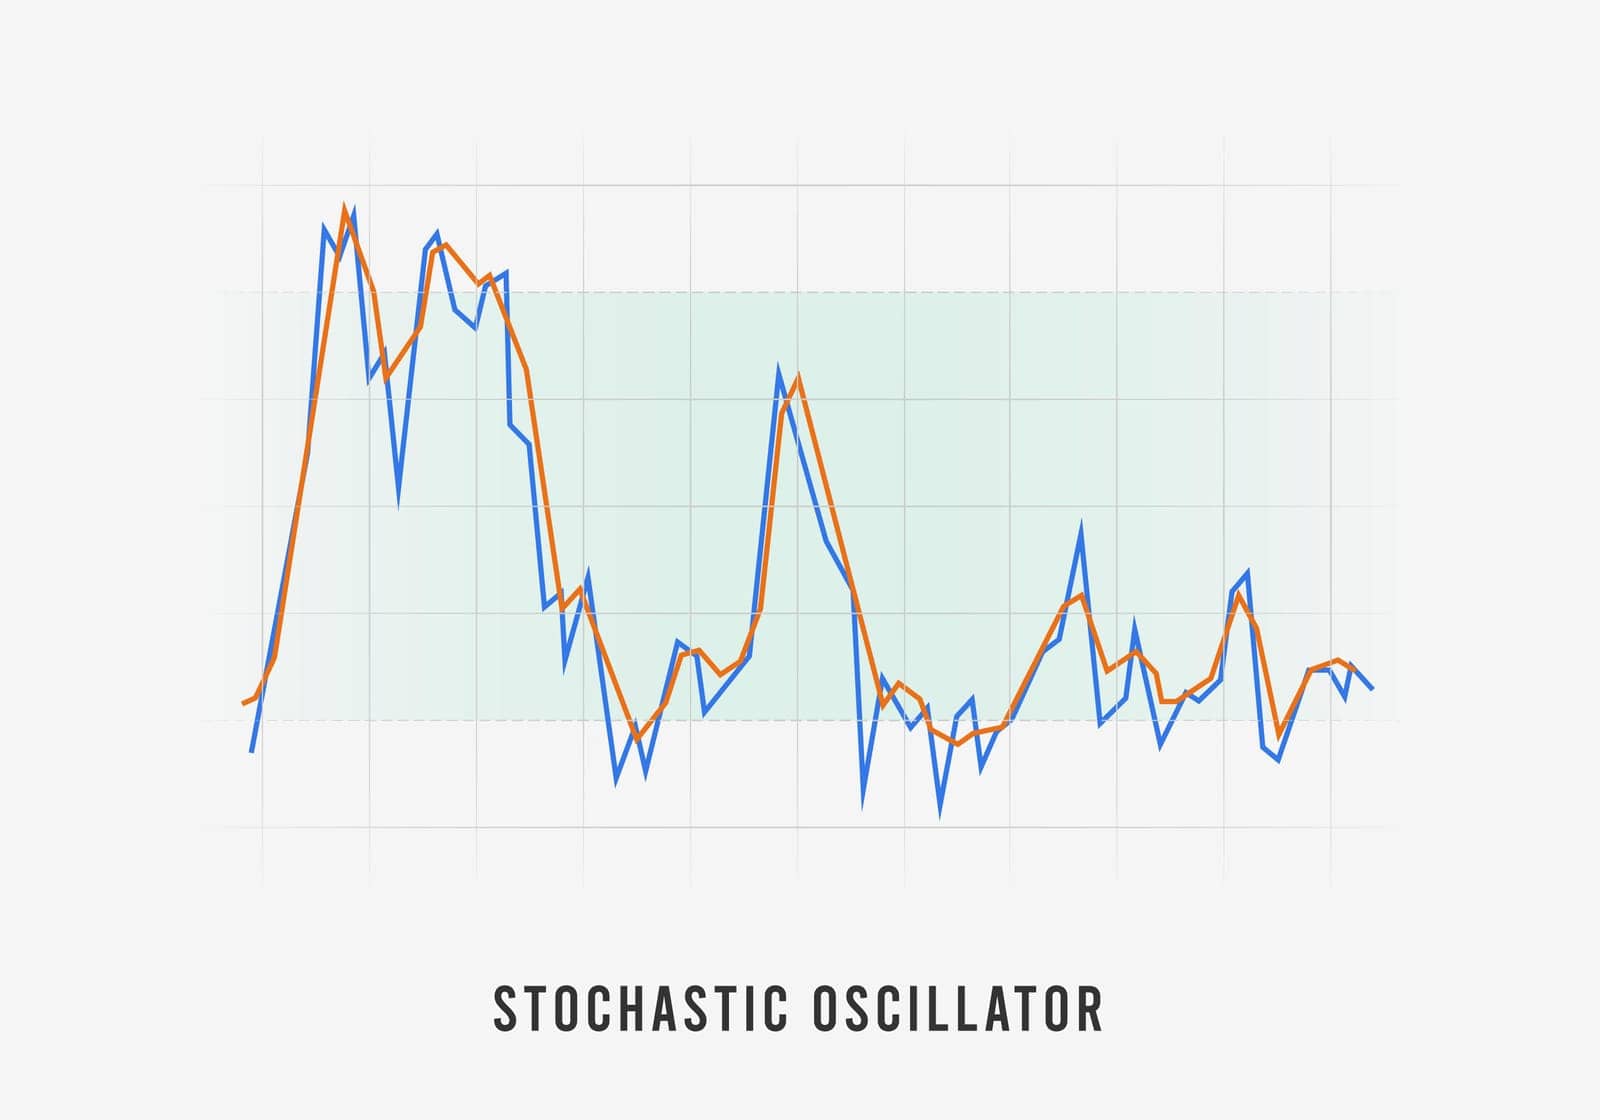
Stochastic Oscillator momentum indicator for stock market technical analysis. Strategies for trading and investment. Forex and cryptocurrency exchange market. Vector illustration concept
VectorUsername
bestforbestResolution
5000x3500pxStochastic Oscillator momentum indicator for stock market technical analysis. Strategies for trading and investment. Forex and cryptocurrency exchange market. Vector illustration concept

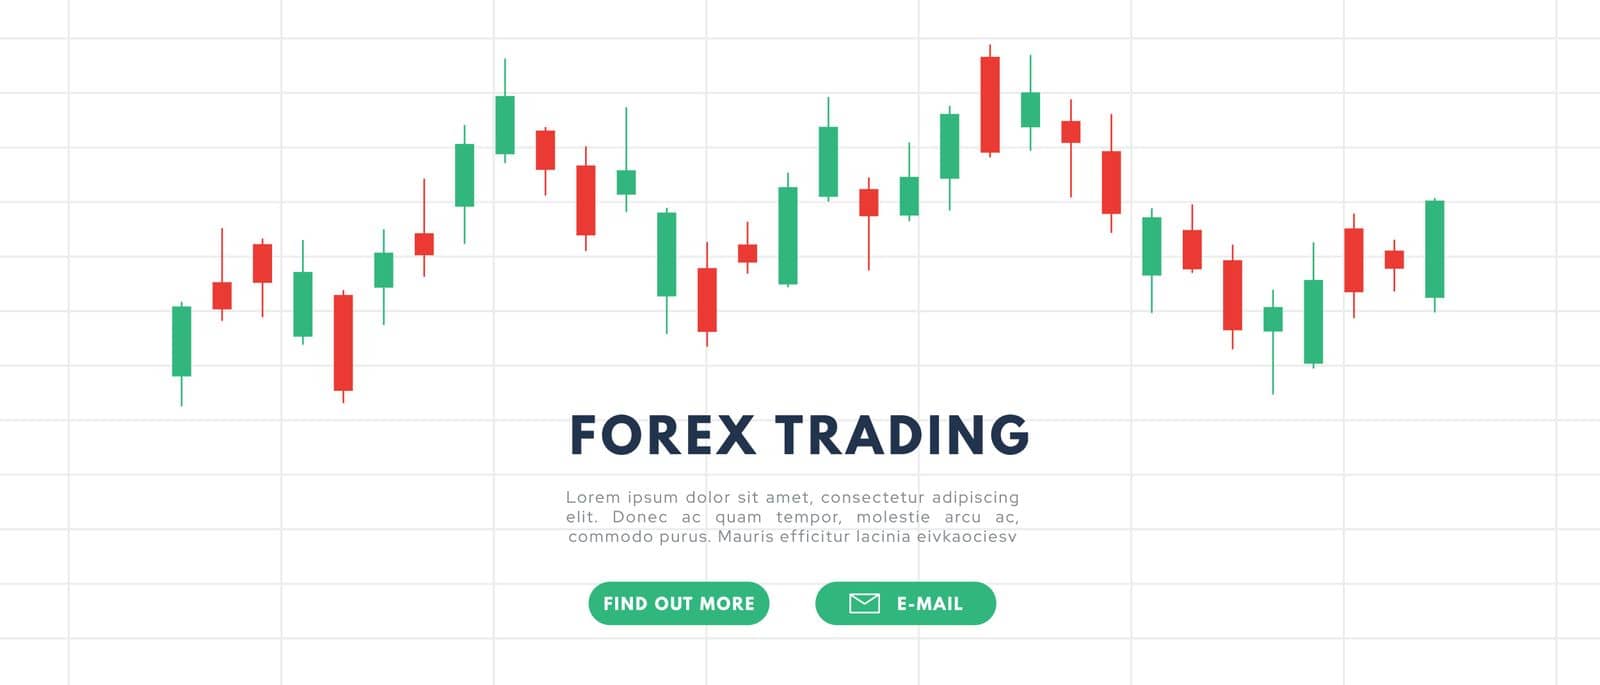
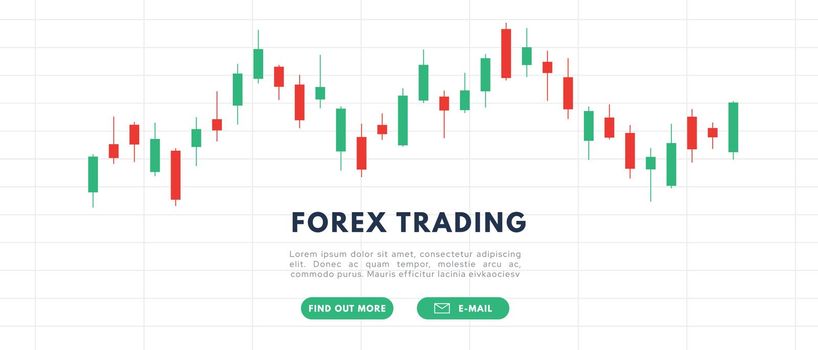
Forex Trading banner. Stock market candlestick, chart green and red japanese candle stick. Chart of buy and sell indicators vector illustration
VectorUsername
vikalostResolution
3660x1647pxForex Trading banner. Stock market candlestick, chart green and red japanese candle stick. Chart of buy and sell indicators vector illustration

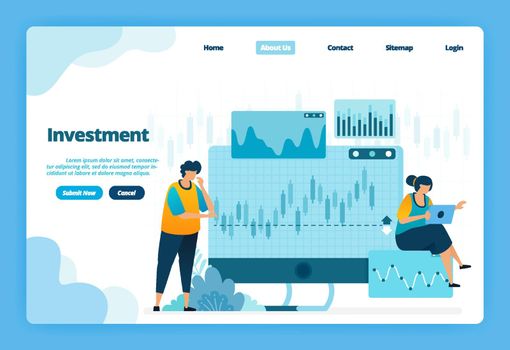
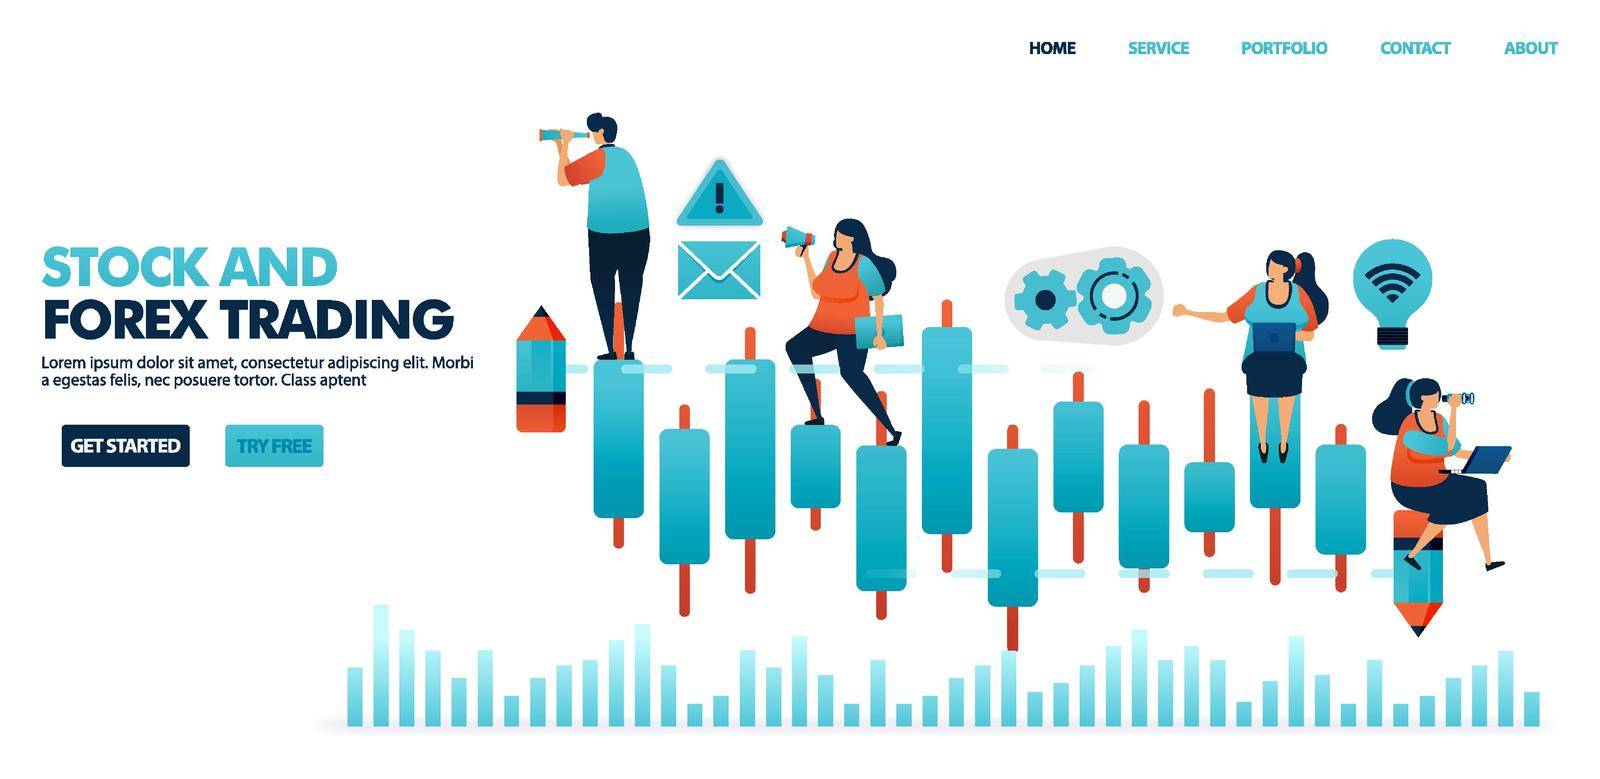
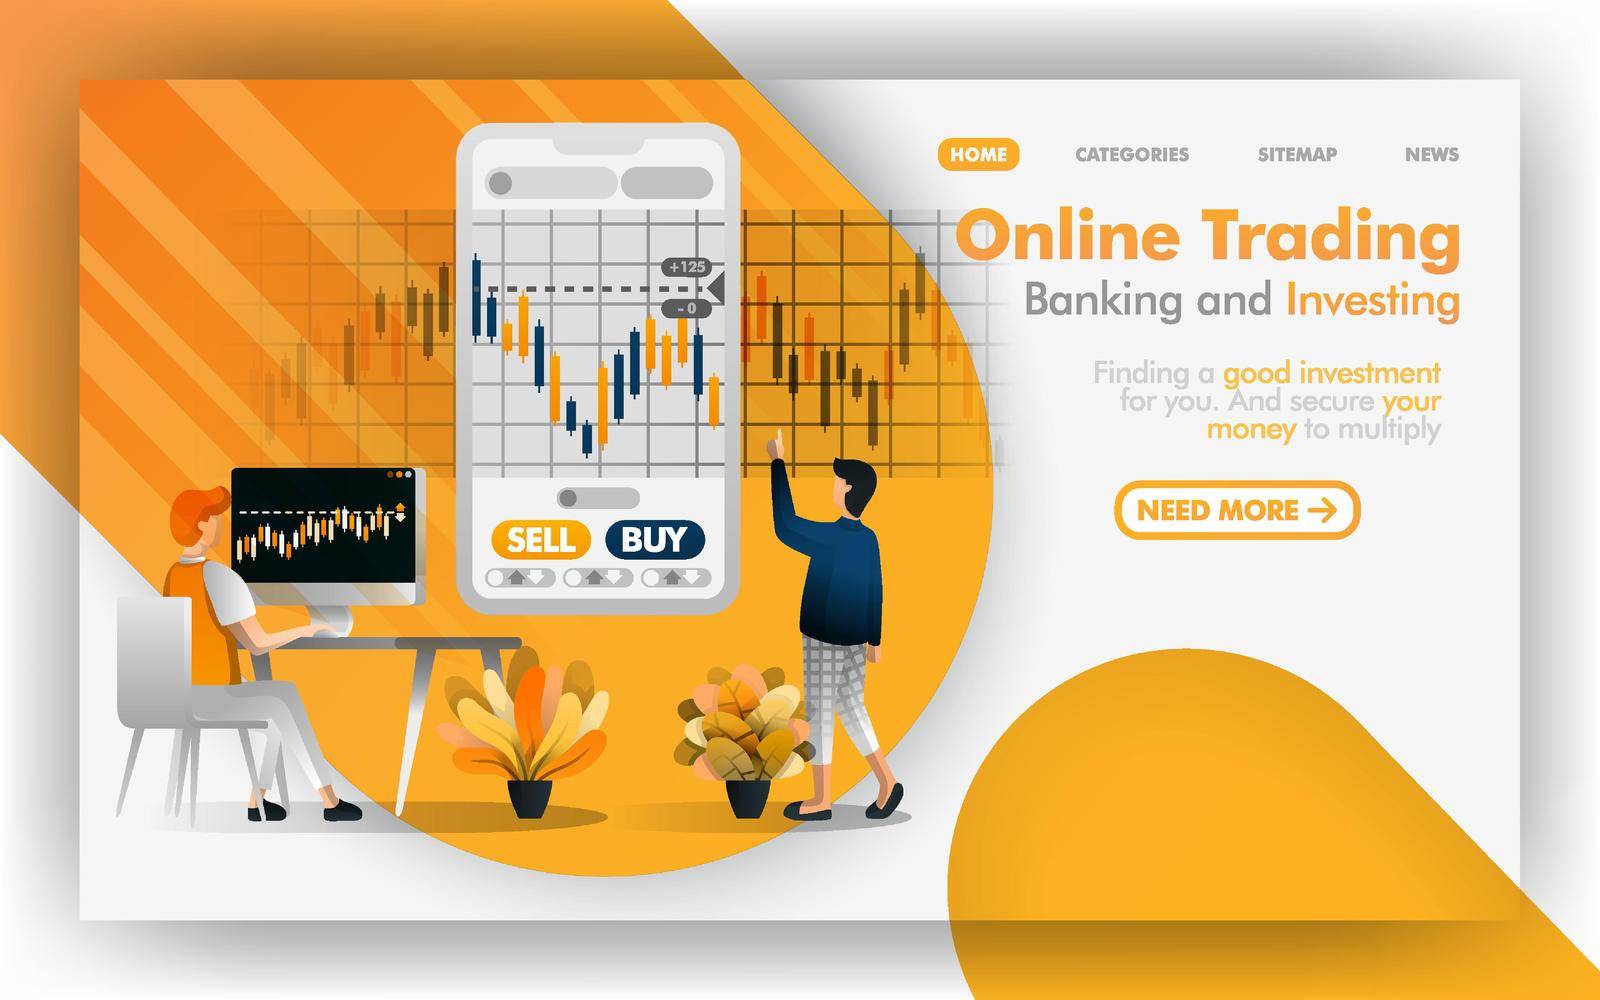
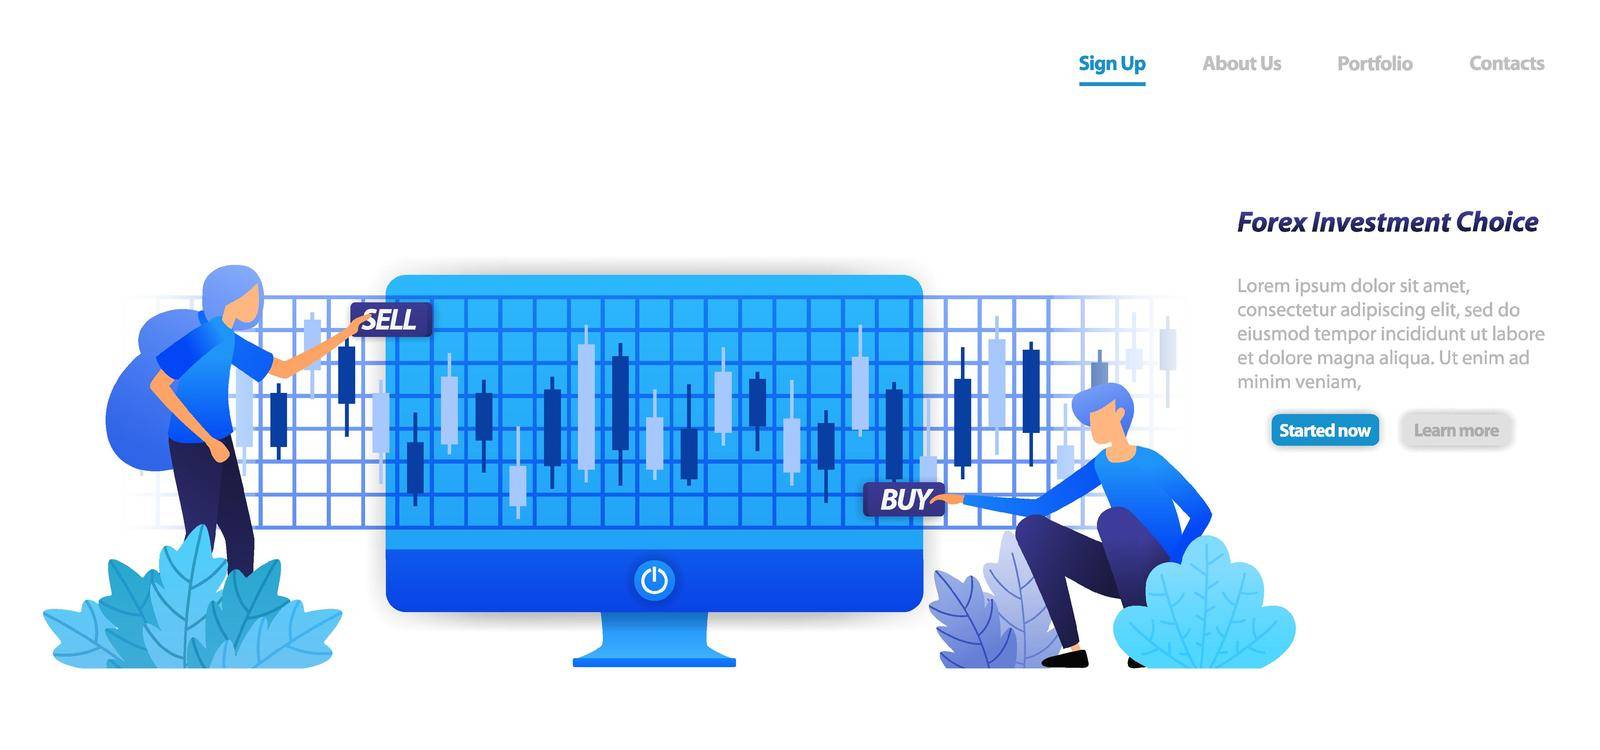
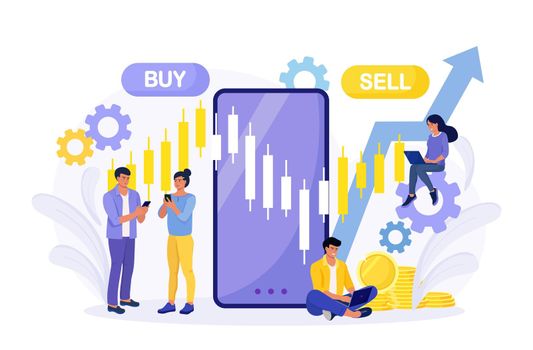
Landing page of investment. Forex for modern investment options with trade in currencies and commodities. Illustration of landing page, website, mobile apps, poster, flyer
VectorUsername
yayimageResolution
5361x3681pxLanding page of investment. Forex for modern investment options with trade in currencies and commodities. Illustration of landing page, website, mobile apps, poster, flyer
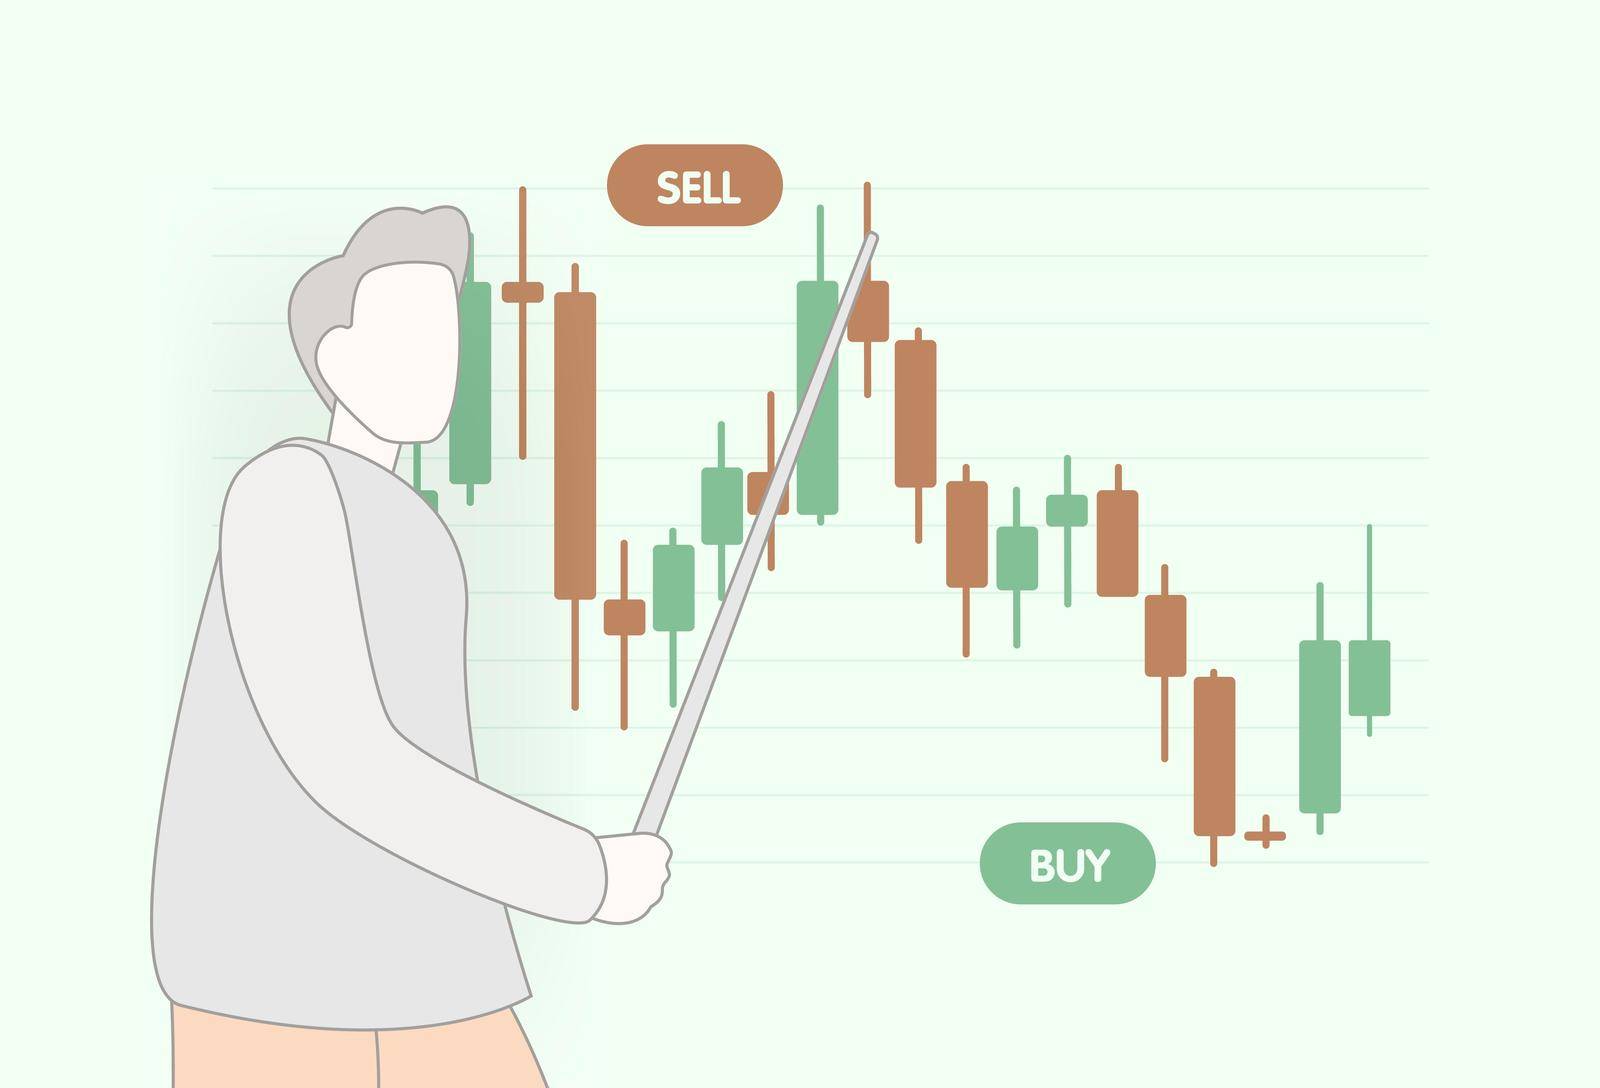
Webinar, seminar or lecture on financial trading on stock, forex or crypto market. Business financial analyst character tells how to trade with candlesticks, where to invest, buy, sell assets
VectorUsername
bestforbestResolution
5000x3400pxWebinar, seminar or lecture on financial trading on stock, forex or crypto market. Business financial analyst character tells how to trade with candlesticks, where to invest, buy, sell assets


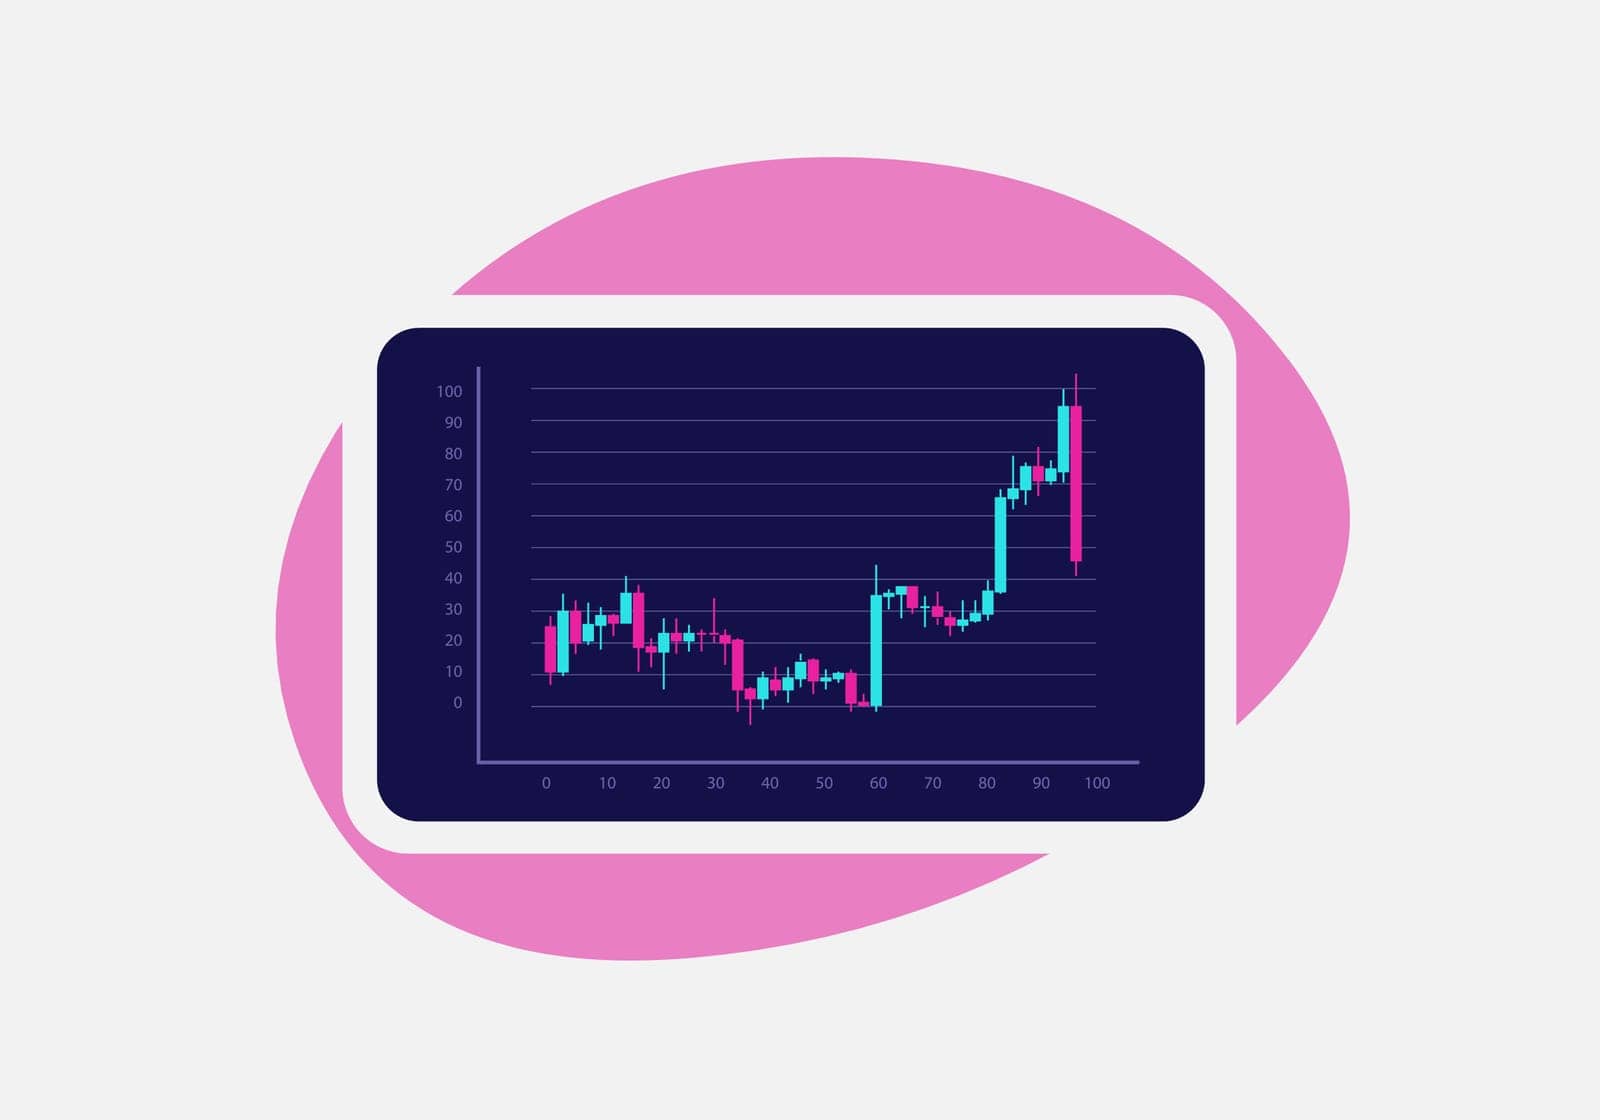
Japanese candlestick icon. Stock market chart, crypto, forex trading graph with modern candlesticks on dark background. Online trading, technical analysis, financial business concept
VectorUsername
bestforbestResolution
5000x3800pxJapanese candlestick icon. Stock market chart, crypto, forex trading graph with modern candlesticks on dark background. Online trading, technical analysis, financial business concept


Japanese candlesticks, popular technical analysis tool used in stock, forex and crypto markets. Curved volumetric design emphasizes dynamic nature of the markets and importance of visualizing trends
VectorUsername
bestforbestResolution
5000x3600pxJapanese candlesticks, popular technical analysis tool used in stock, forex and crypto markets. Curved volumetric design emphasizes dynamic nature of the markets and importance of visualizing trends

Stock market, forex trading graph with green and red japanese candlesticks on dark grey background for financial and business concept. Online trading technical analysis vector icon concept
VectorUsername
bestforbestResolution
5000x3500pxStock market, forex trading graph with green and red japanese candlesticks on dark grey background for financial and business concept. Online trading technical analysis vector icon concept

Stock market chart or crypto, forex trading graph with green and red japanese candlesticks for financial and business concept on dark grey background. Online trading technical analysis for investment
VectorUsername
bestforbestResolution
5000x3500pxStock market chart or crypto, forex trading graph with green and red japanese candlesticks for financial and business concept on dark grey background. Online trading technical analysis for investment
Simple trading candles background. Stock market forex or crypto trading concept suitable for financial investment or Economic trends business idea. Abstract finance background. Vector illustration
VectorUsername
DvorakResolution
8000x2915pxSimple trading candles background. Stock market forex or crypto trading concept suitable for financial investment or Economic trends business idea. Abstract finance background. Vector illustration


Trading candles pattern background. Stock market forex or crypto trading concept suitable for financial investment or Economic trends business idea. Abstract finance background. Vector illustration
VectorUsername
DvorakResolution
5965x3363pxTrading candles pattern background. Stock market forex or crypto trading concept suitable for financial investment or Economic trends business idea. Abstract finance background. Vector illustration

Simple trading candles background. Stock market forex or crypto trading concept suitable for financial investment or Economic trends business idea. Abstract finance background. Vector illustration
VectorUsername
DvorakResolution
6500x2369pxSimple trading candles background. Stock market forex or crypto trading concept suitable for financial investment or Economic trends business idea. Abstract finance background. Vector illustration

Simple trading candles background. Stock market forex or crypto trading concept suitable for financial investment or Economic trends business idea. Abstract finance background. Vector illustration
VectorUsername
DvorakResolution
8000x2915pxSimple trading candles background. Stock market forex or crypto trading concept suitable for financial investment or Economic trends business idea. Abstract finance background. Vector illustration
Vector illustration for website. Candlestick chart in financial market with green and white background Forex trading graphic design concept. can be used for poster, web, app, document, presentation
VectorUsername
yayimageResolution
10000x5000pxVector illustration for website. Candlestick chart in financial market with green and white background Forex trading graphic design concept. can be used for poster, web, app, document, presentation
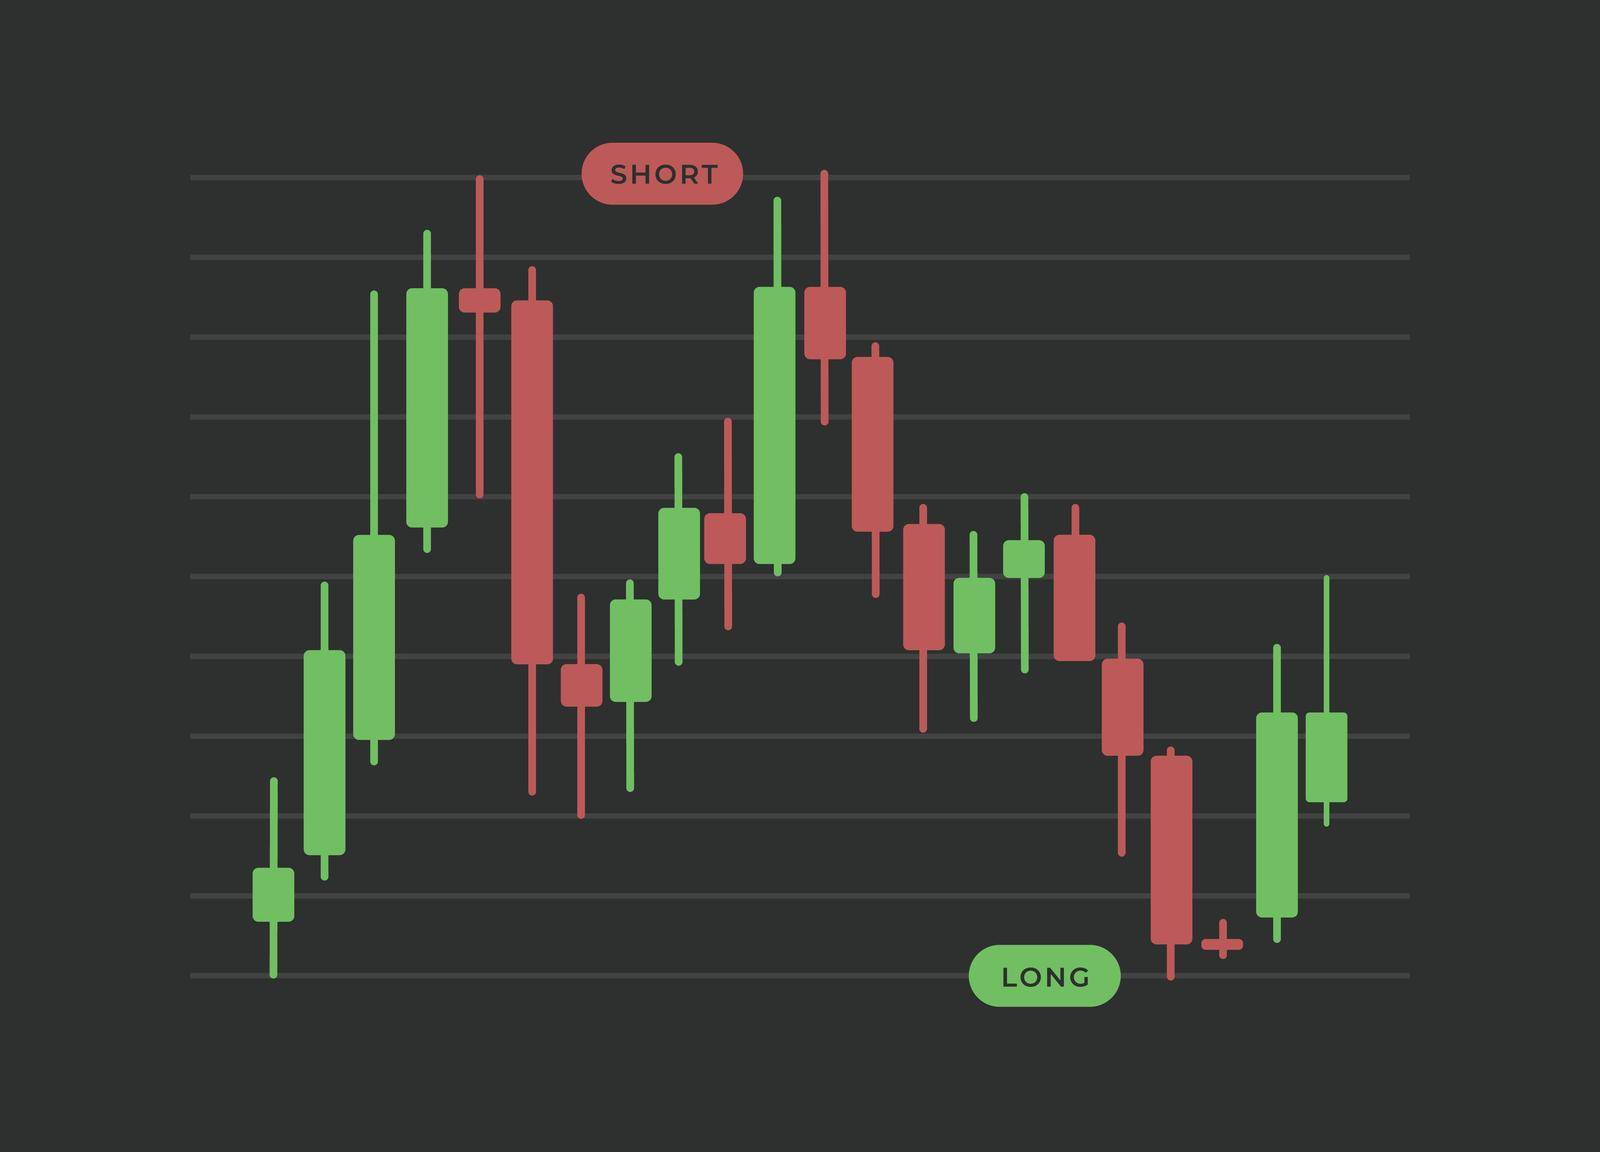
Long and Short Position with Margin Trading concept. Buy and Sell buttons with up and down arrows and price candles chart. Bull and Bear, Stock, crypto or forex currency exchange with green, red bars
VectorUsername
bestforbestResolution
5000x3600pxLong and Short Position with Margin Trading concept. Buy and Sell buttons with up and down arrows and price candles chart. Bull and Bear, Stock, crypto or forex currency exchange with green, red bars


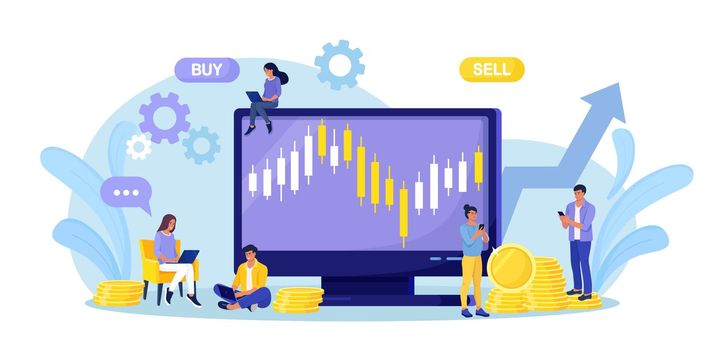
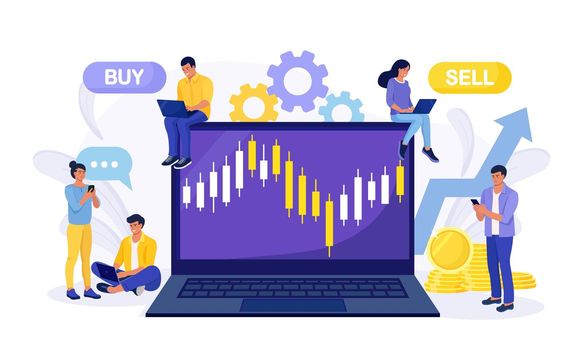
Tiny people stock traders buy and sell shares at computer. Technical analysis candlestick chart. Global stock market index, trade exchange. Forex trading strategy. Investing in Stocks
VectorUsername
TanushkaBuResolution
9975x4821pxTiny people stock traders buy and sell shares at computer. Technical analysis candlestick chart. Global stock market index, trade exchange. Forex trading strategy. Investing in Stocks
Candle chart in forex trading, stock, mutual funds, commodity, currency. People see company performance to choose a issuer in mixed investment. Human illustration for website, mobile apps, poster
VectorUsername
yayimageResolution
7917x3854pxCandle chart in forex trading, stock, mutual funds, commodity, currency. People see company performance to choose a issuer in mixed investment. Human illustration for website, mobile apps, poster

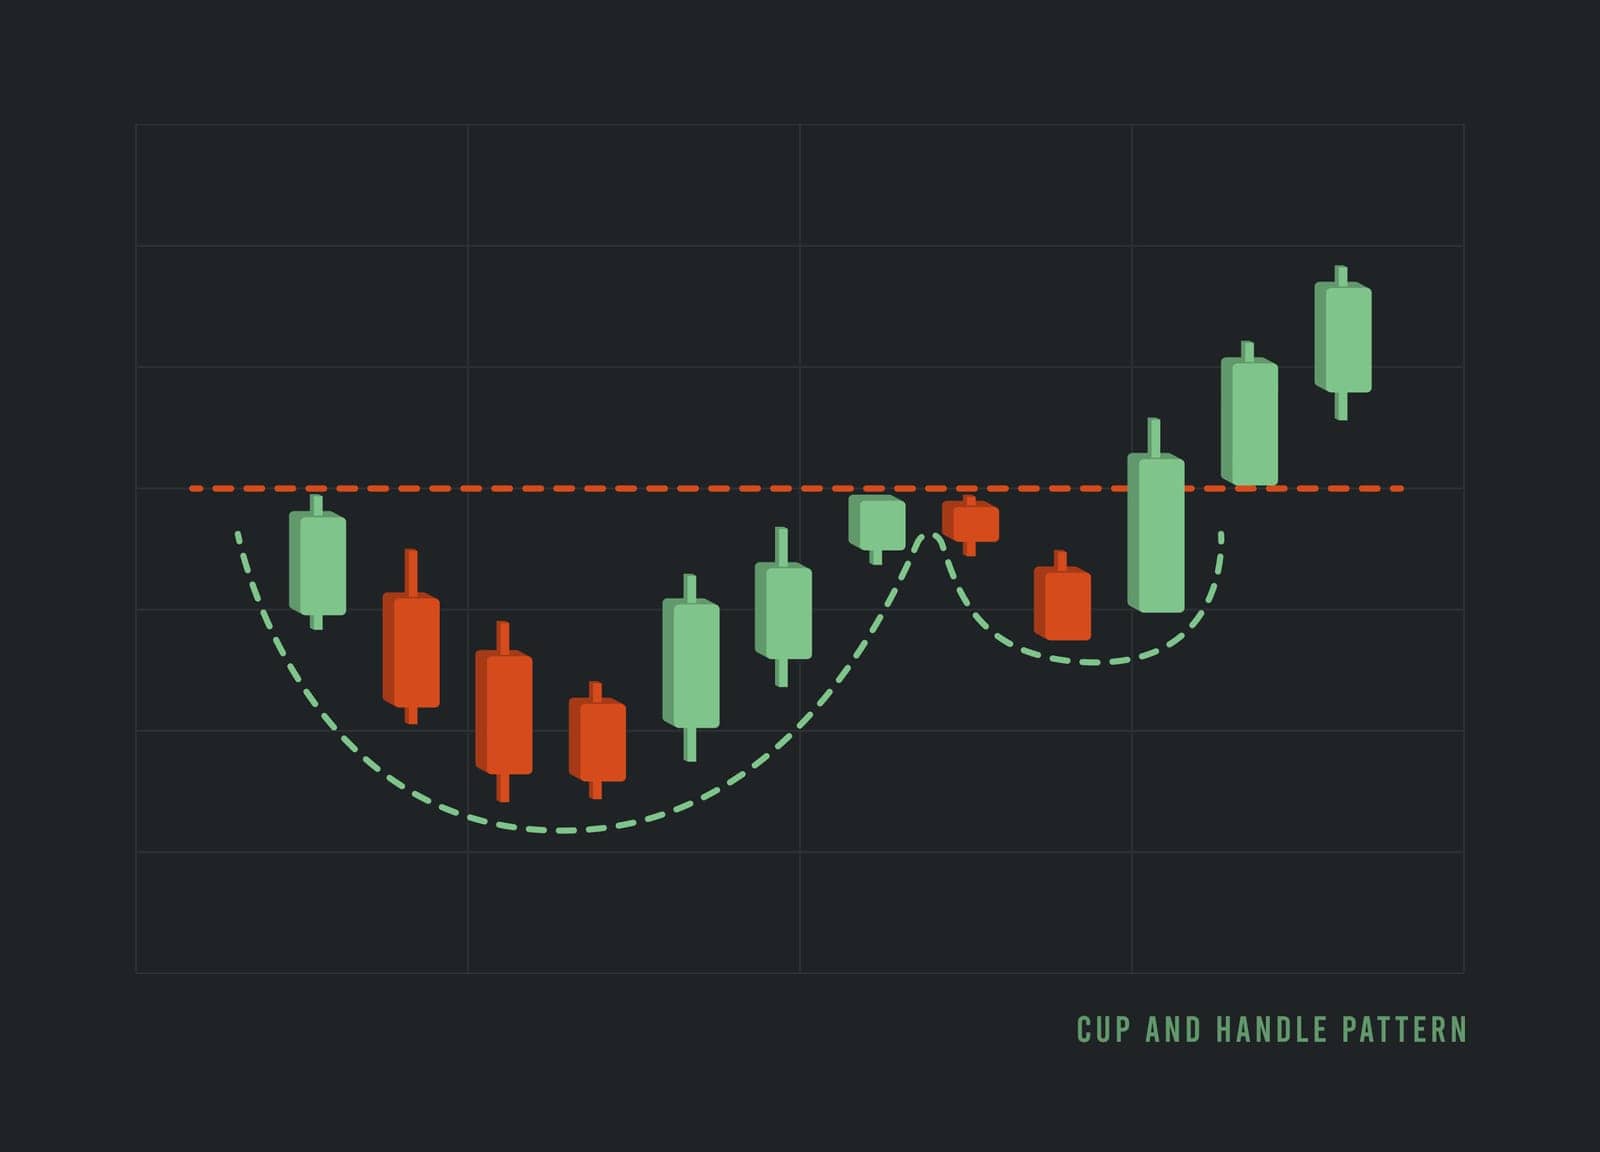
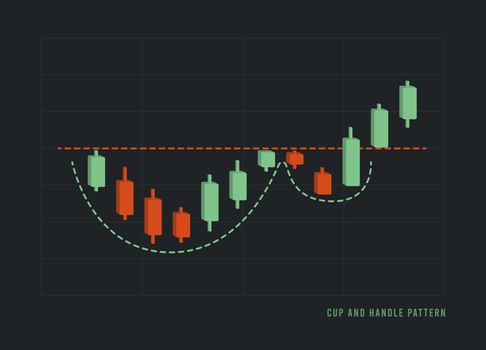
Cup and Handle Pattern - bullish technical analysis continuation trend chart figure. Stock, cryptocurrency graph, forex analytics, trading market price breakout vector illustration, black background
VectorUsername
bestforbestResolution
5000x3600pxCup and Handle Pattern - bullish technical analysis continuation trend chart figure. Stock, cryptocurrency graph, forex analytics, trading market price breakout vector illustration, black background

Tiny people stock traders buy and sell shares at computer, laptop. Technical analysis candlestick chart. Global stock market index, trade exchange. Forex trading strategy. Investing in Stocks
VectorUsername
TanushkaBuResolution
8750x5250pxTiny people stock traders buy and sell shares at computer, laptop. Technical analysis candlestick chart. Global stock market index, trade exchange. Forex trading strategy. Investing in Stocks

Tiny people stock traders buy and sell shares at computer, laptop. Technical analysis candlestick chart. Global stock market index, trade exchange. Forex trading strategy. Investing in Stocks
VectorUsername
TanushkaBuResolution
9975x5463pxTiny people stock traders buy and sell shares at computer, laptop. Technical analysis candlestick chart. Global stock market index, trade exchange. Forex trading strategy. Investing in Stocks


Transfer and send money with application. trade between currencies. forex trading apps, concept vector ilustration. can use for landing page, template, ui, web, mobile app, poster, banner, flyer
VectorUsername
yayimageResolution
5556x4583pxTransfer and send money with application. trade between currencies. forex trading apps, concept vector ilustration. can use for landing page, template, ui, web, mobile app, poster, banner, flyer

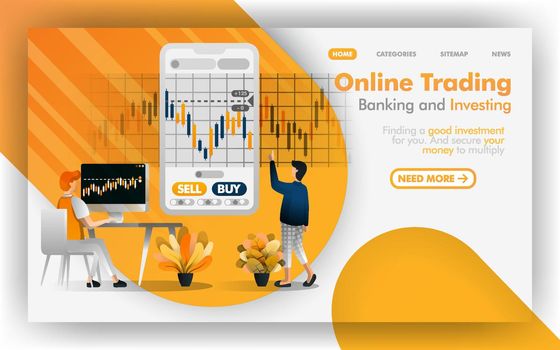
Forex online trading, banking, investment Vector Illustration concept, people determine investment. Easy to use for website, banner, landing page, brochure, flyer, print, mobile, poster, template, UI
VectorUsername
yayimageResolution
5000x3125pxForex online trading, banking, investment Vector Illustration concept, people determine investment. Easy to use for website, banner, landing page, brochure, flyer, print, mobile, poster, template, UI
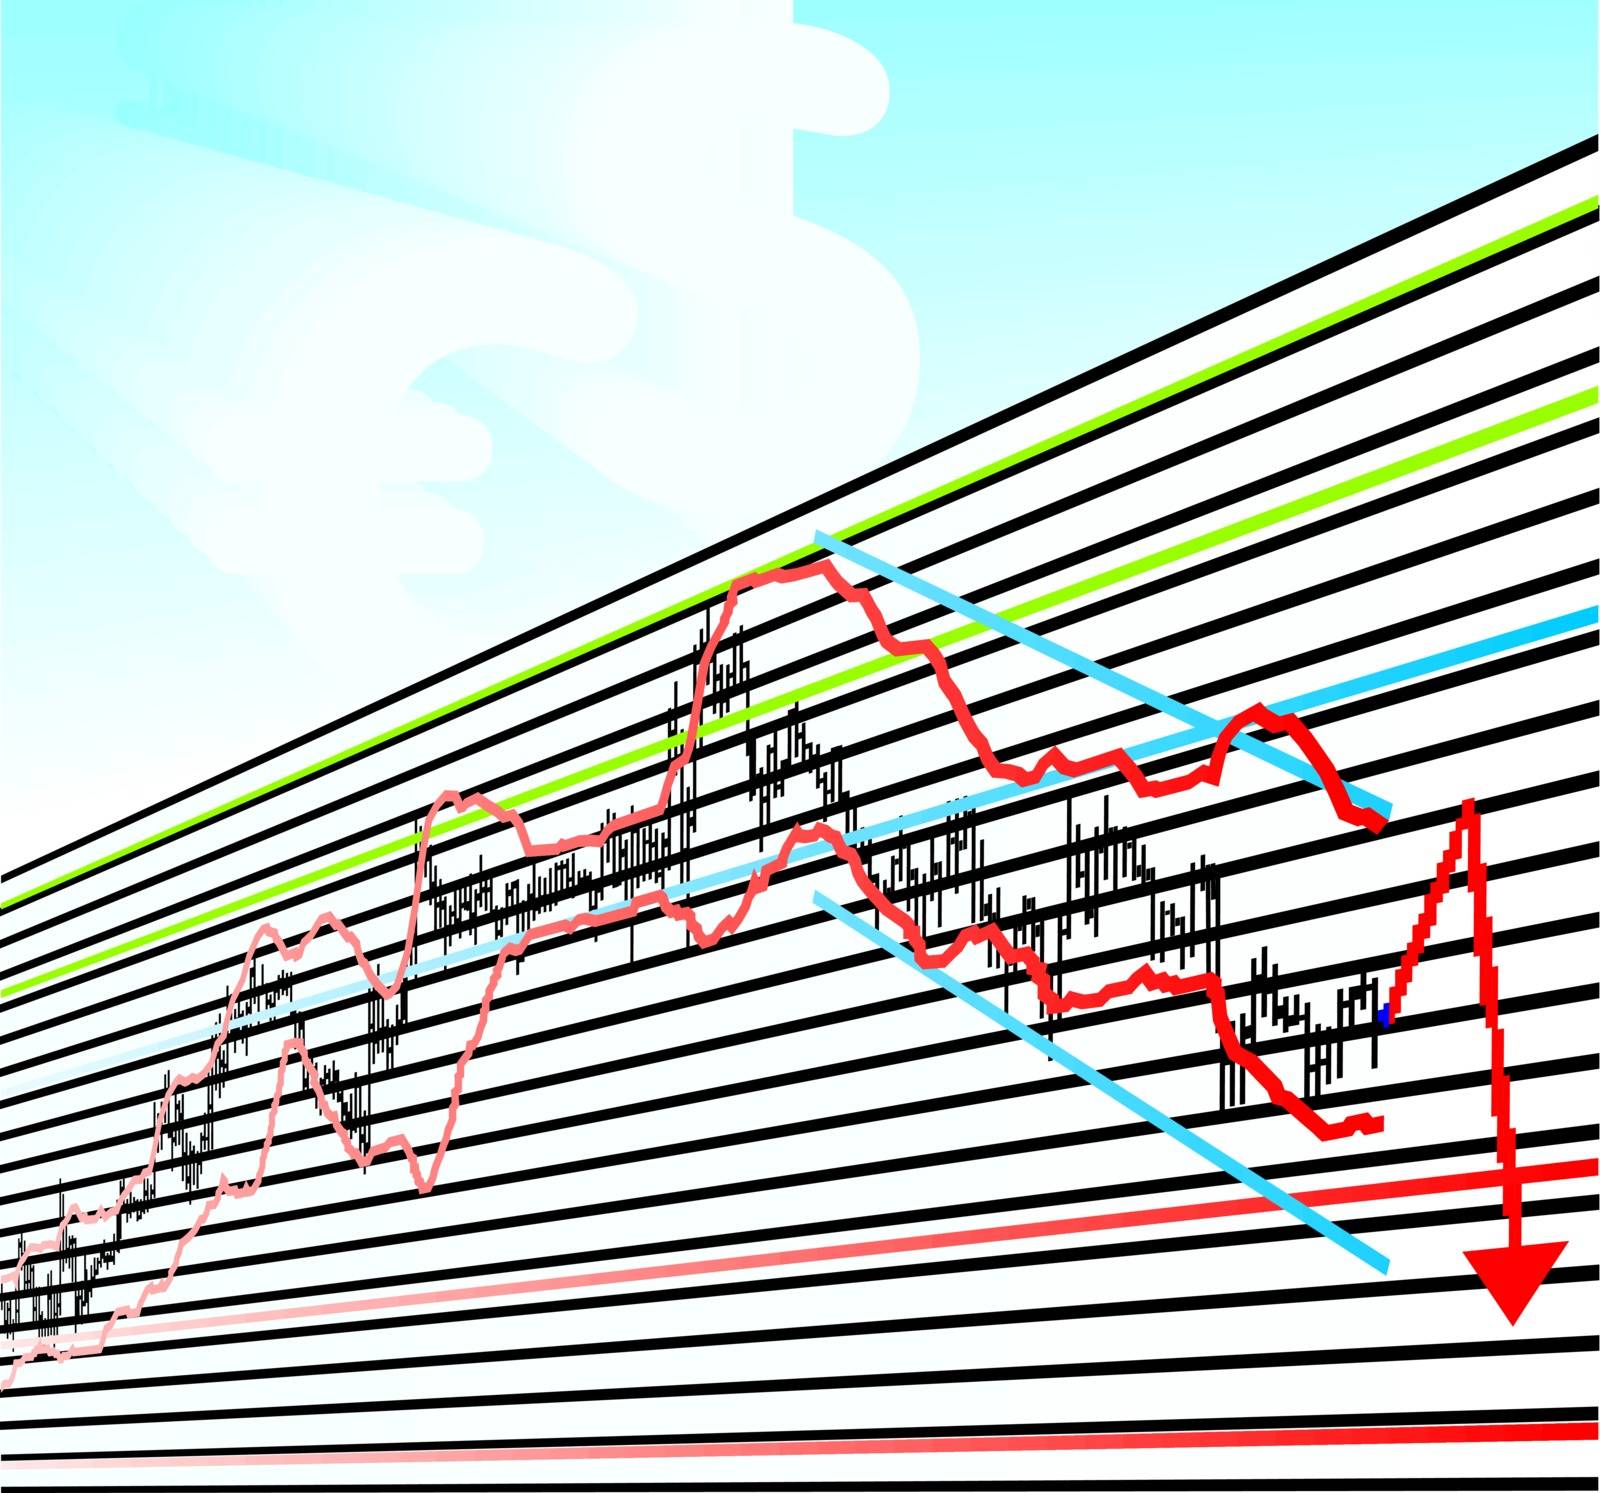
action on a financial investment buy sell or loss profits is risk in stock forex investment decisions. flat illustration concept for landing page, web, ui, banner, flyer, poster, template, background
VectorUsername
yayimageResolution
6400x3000pxaction on a financial investment buy sell or loss profits is risk in stock forex investment decisions. flat illustration concept for landing page, web, ui, banner, flyer, poster, template, background


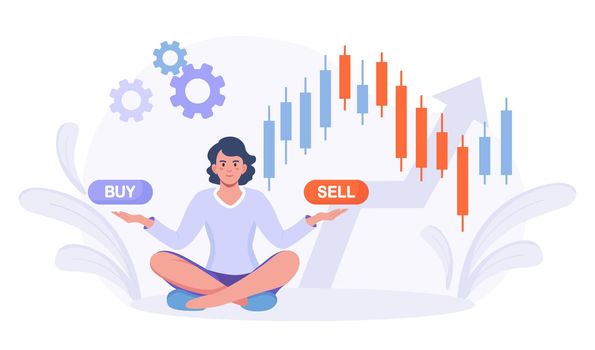
Woman trader with buy, sell buttons. Technical analysis candlestick chart. Global stock market index, trade exchange. Forex trading strategy. Finance growth, Data analysis. Person Investing in Stocks
VectorUsername
TanushkaBuResolution
8500x5000pxWoman trader with buy, sell buttons. Technical analysis candlestick chart. Global stock market index, trade exchange. Forex trading strategy. Finance growth, Data analysis. Person Investing in Stocks
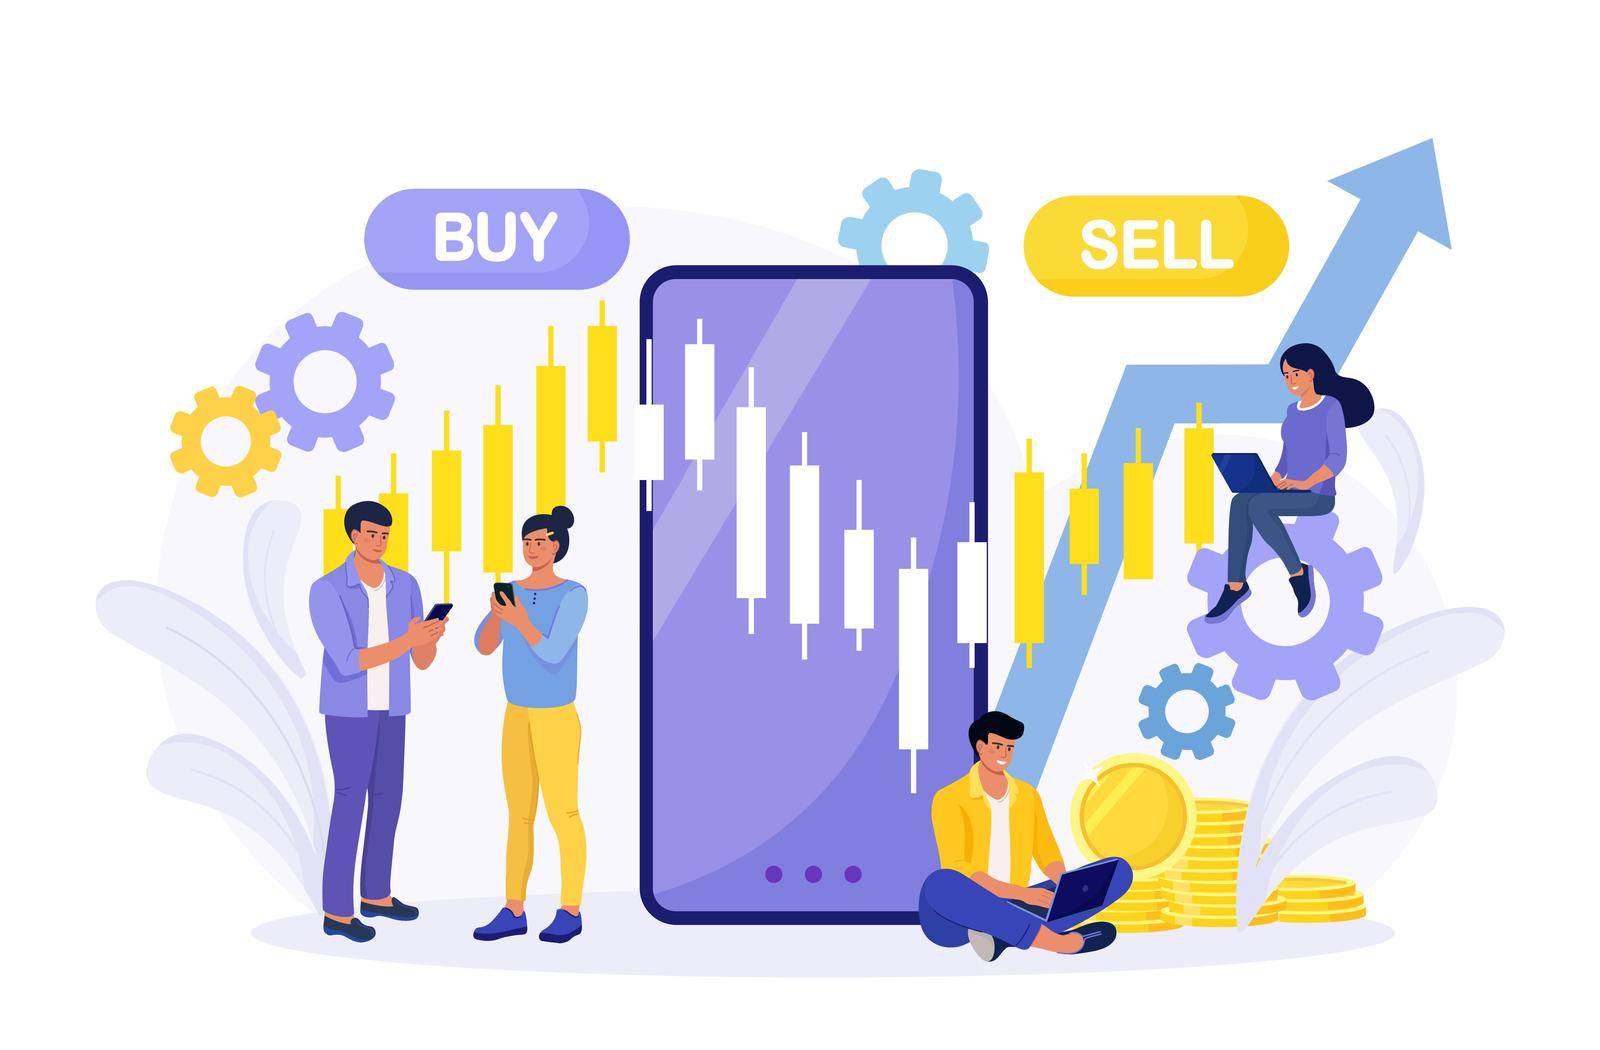
Tiny people stock traders buy and sell shares with mobile phone app. Technical analysis candlestick chart. Global stock market index, trade exchange. Forex trading strategy. Investing in Stocks
VectorUsername
TanushkaBuResolution
8000x5250pxTiny people stock traders buy and sell shares with mobile phone app. Technical analysis candlestick chart. Global stock market index, trade exchange. Forex trading strategy. Investing in Stocks
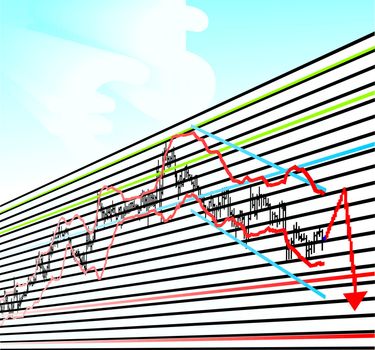
Business Loss Graphs
VectorUsername
ard1Resolution
5000x4665pxBusiness Loss Graphs

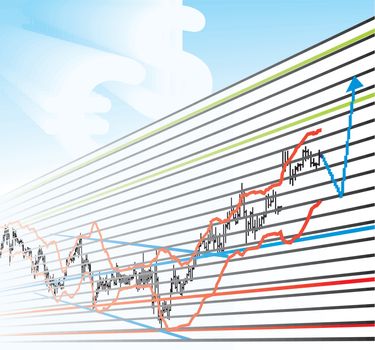
Business Profit Graphs, vector
VectorUsername
ard1Resolution
5000x4671pxBusiness Profit Graphs, vector

Efficient market trend analysis
VectorUsername
LembergvectorResolution
7200x4500pxEfficient market trend analysis


Trading market signals
VectorUsername
LembergvectorResolution
7200x4500pxTrading market signals

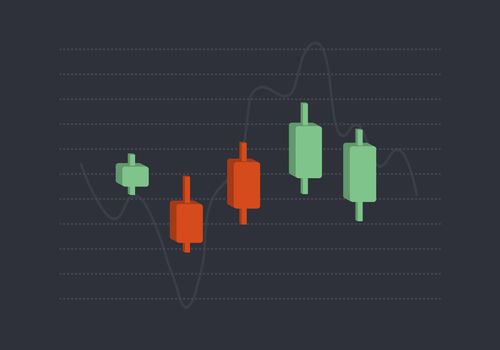
Candlestick chart showing progress and growth of company
VectorUsername
pchvectorResolution
7000x5000pxCandlestick chart showing progress and growth of company


Candlestick chart showing progress and growth of company
VectorUsername
pchvectorResolution
7000x5000pxCandlestick chart showing progress and growth of company


MACD Moving Average Convergence Divergence indicator technical analysis
VectorUsername
JulsIstResolution
6948x3598pxMACD Moving Average Convergence Divergence indicator technical analysis


MACD Moving Average Convergence Divergence indicator technical analysis
VectorUsername
JulsIstResolution
6948x3598pxMACD Moving Average Convergence Divergence indicator technical analysis


MACD Moving Average Convergence Divergence indicator technical analysis
VectorUsername
JulsIstResolution
6948x3598pxMACD Moving Average Convergence Divergence indicator technical analysis


MACD Moving Average Convergence Divergence indicator technical analysis
VectorUsername
JulsIstResolution
6948x3598pxMACD Moving Average Convergence Divergence indicator technical analysis


MACD Moving Average Convergence Divergence indicator technical analysis
VectorUsername
JulsIstResolution
6948x3598pxMACD Moving Average Convergence Divergence indicator technical analysis


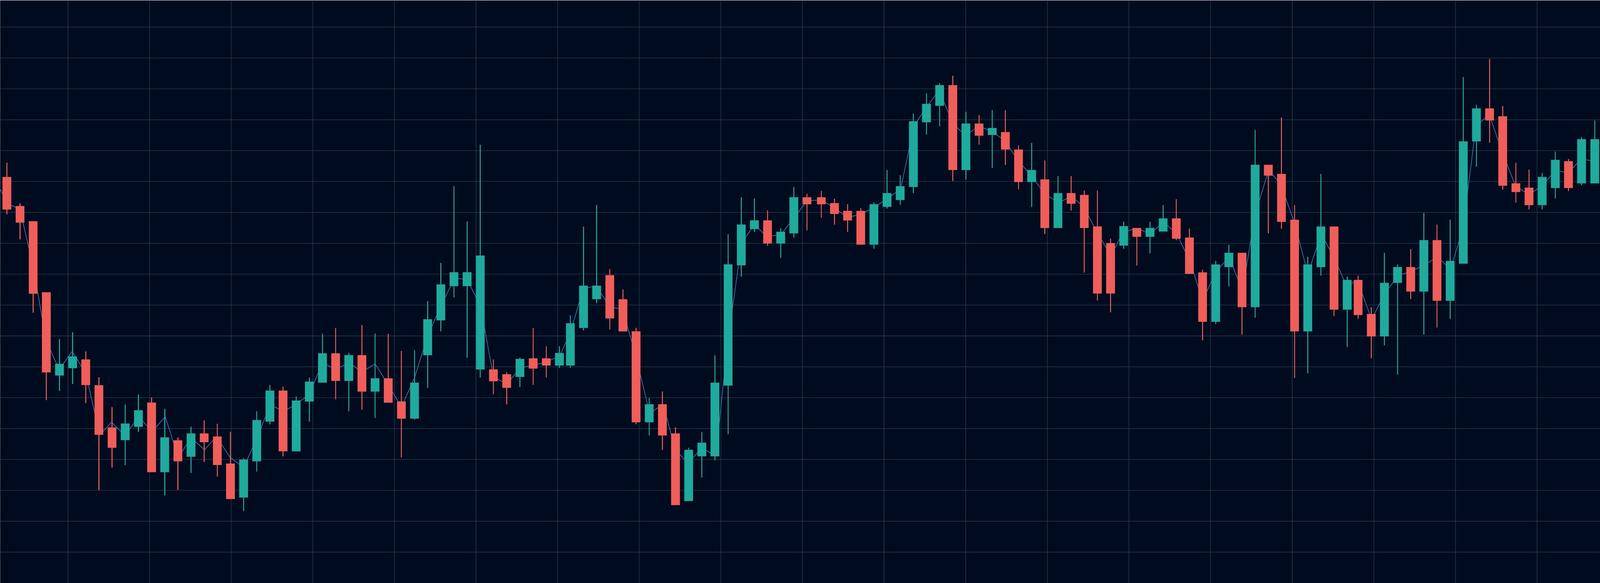
Candlestick stock exchange background vector
VectorUsername
h-santimaResolution
5000x4902pxCandlestick stock exchange background vector


RSI Relative Strength Index acronym Indicator technical analysis Cryptocurrency
VectorUsername
JulsIstResolution
6948x3598pxRSI Relative Strength Index acronym Indicator technical analysis Cryptocurrency


RSI Relative Strength Index acronym Indicator technical analysis Cryptocurrency
VectorUsername
JulsIstResolution
6948x3598pxRSI Relative Strength Index acronym Indicator technical analysis Cryptocurrency


money currency exchange line icon
VectorUsername
Francois_PoirierResolution
4950x4778pxmoney currency exchange line icon


group of business people
VectorUsername
kjpargeterResolution
1135x851pxgroup of business people


USD Coin landing web page
VectorUsername
MakeVectorResolution
7800x4200pxUSD Coin landing web page


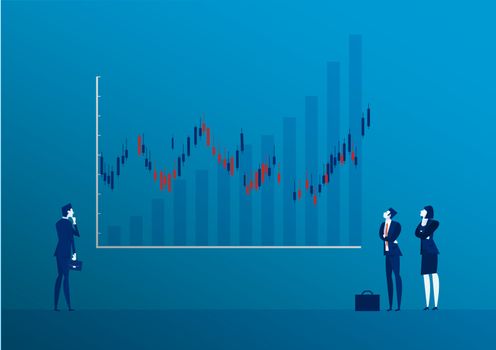
Businessman back view standing looking at candle stick graph stock market illustration
VectorUsername
mhammad_usengResolution
5000x3535pxBusinessman back view standing looking at candle stick graph stock market illustration

Businessman back view standing looking at candle stick graph stock market illustration
VectorUsername
mhammad_usengResolution
5000x3535pxBusinessman back view standing looking at candle stick graph stock market illustration


symbol,tv,icon,sign,isolated,screen,presentation,computer,modern,web,stats,flat,design,vector,up,graphic,image,business,large,television,display,format,monitor,technology,forex,graph,diagram,illustration,device,chart,board
VectorUsername
ogqcorpResolution
471x470pxsymbol,tv,icon,sign,isolated,screen,presentation,computer,modern,web,stats,flat,design,vector,up,graphic,image,business,large,television,display,format,monitor,technology,forex,graph,diagram,illustration,device,chart,board


Modern flat illustration with gold currency exchange yen. Flat vector illustration
VectorUsername
Vector-UpResolution
8265x4723pxModern flat illustration with gold currency exchange yen. Flat vector illustration
