stats Royalty Free Vector Images (3,134)
Page 3 of 63
Business Consulting Talk Stats Logo, Speech Bubble and Growth Graph Vector Design
VectorUsername
denayuneyiResolution
5000x5000pxBusiness Consulting Talk Stats Logo, Speech Bubble and Growth Graph Vector Design
Business Consulting Talk Stats Logo, Speech Bubble and Growth Graph Vector Design
VectorUsername
denayuneyiResolution
5000x5000pxBusiness Consulting Talk Stats Logo, Speech Bubble and Growth Graph Vector Design

Stats on Cell icon vector image. Suitable for mobile apps, web apps and print media.
VectorUsername
ICONBUNNYResolution
5120x5120pxStats on Cell icon vector image. Suitable for mobile apps, web apps and print media.


Auto Car Marketing Logo Template Design, Automotive Market Stats Logo Design Template
VectorUsername
meisusenoResolution
1200x960pxAuto Car Marketing Logo Template Design, Automotive Market Stats Logo Design Template


Auto Car Marketing Logo Template Design, Automotive Market Stats Logo Design Template
VectorUsername
meisusenoResolution
1200x960pxAuto Car Marketing Logo Template Design, Automotive Market Stats Logo Design Template


Auto Car Marketing Logo Template Design, Automotive Market Stats Logo Design Template
VectorUsername
meisusenoResolution
1200x960pxAuto Car Marketing Logo Template Design, Automotive Market Stats Logo Design Template


Email Marketing Statistics landing page template illustration. E-mail digital marketing statistics. B2B, B2C email stats for retention strategy and revenue generator.
VectorUsername
bestforbestResolution
5000x3600pxEmail Marketing Statistics landing page template illustration. E-mail digital marketing statistics. B2B, B2C email stats for retention strategy and revenue generator.


Influencer Marketing Statistics and smm analytics with engaging visuals. Illustrate influencer stats reach, engagement rates. Affiliate marketing statistics with social media marketing strategy
VectorUsername
bestforbestResolution
5000x3800pxInfluencer Marketing Statistics and smm analytics with engaging visuals. Illustrate influencer stats reach, engagement rates. Affiliate marketing statistics with social media marketing strategy


Infographic with stats dashboard on mobile video growth. Video analytics charts with rising viewership, session length, top videos, essential metrics for effective mobile ad campaigns
VectorUsername
bestforbestResolution
5000x3700pxInfographic with stats dashboard on mobile video growth. Video analytics charts with rising viewership, session length, top videos, essential metrics for effective mobile ad campaigns


Video Marketing potential concept illustration. Native social marketing, targeted programmatic advertising stats to enhance your online digital marketing strategy. Linear Isometric Vector illustration
VectorUsername
bestforbestResolution
5000x3600pxVideo Marketing potential concept illustration. Native social marketing, targeted programmatic advertising stats to enhance your online digital marketing strategy. Linear Isometric Vector illustration


Content Management System - CMS website interface concept. Allows users to edit design, access config settings, create and publish articles, manage administration, and view stats
VectorUsername
bestforbestResolution
5000x3500pxContent Management System - CMS website interface concept. Allows users to edit design, access config settings, create and publish articles, manage administration, and view stats


India map Coronavirus banner. Covid-19, Covid 19 isometric indian map confirmed cases, cure, deaths report. Coronavirus disease 2019 situation update india. Maps show situation and stats
VectorUsername
lunartsResolution
6500x3467pxIndia map Coronavirus banner. Covid-19, Covid 19 isometric indian map confirmed cases, cure, deaths report. Coronavirus disease 2019 situation update india. Maps show situation and stats


India map Coronavirus banner. Covid-19, Covid 19 isometric indian map confirmed cases, cure, deaths report. Coronavirus disease 2019 situation update india. Maps show situation and stats
VectorUsername
lunartsResolution
6500x4333pxIndia map Coronavirus banner. Covid-19, Covid 19 isometric indian map confirmed cases, cure, deaths report. Coronavirus disease 2019 situation update india. Maps show situation and stats


India map Coronavirus banner. Covid-19, Covid 19 isometric indian map confirmed cases, cure, deaths report. Coronavirus disease 2019 situation update india. Maps show situation and stats
VectorUsername
lunartsResolution
6500x3995pxIndia map Coronavirus banner. Covid-19, Covid 19 isometric indian map confirmed cases, cure, deaths report. Coronavirus disease 2019 situation update india. Maps show situation and stats


Statistics - line icon set with editable stroke. Collection of 20 graphs, charts, diagrams.
VectorUsername
indigo_diamondResolution
8334x6876pxStatistics - line icon set with editable stroke. Collection of 20 graphs, charts, diagrams.


Presentation template design with infocharts and analytical data
VectorUsername
aisplResolution
5000x2999pxPresentation template design with infocharts and analytical data


Isometric illustration of working business people or analysts, m
VectorUsername
aisplResolution
5000x2999pxIsometric illustration of working business people or analysts, m


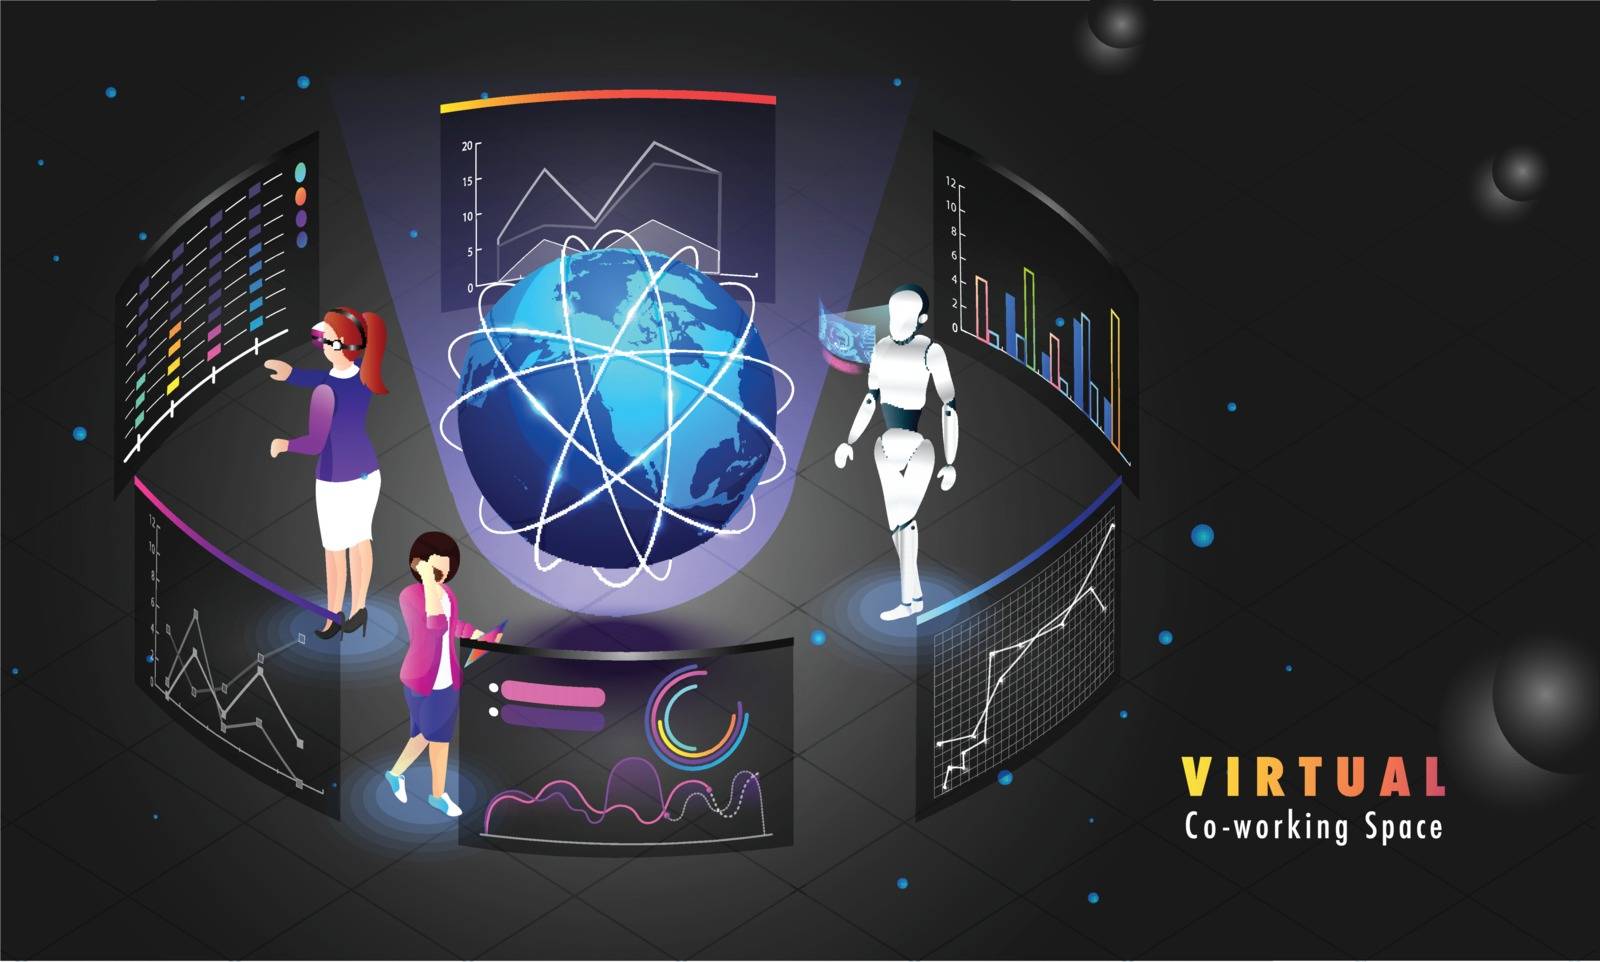
Virtual Co-Working platform, miniature people analysis data or s
VectorUsername
aisplResolution
5000x3014pxVirtual Co-Working platform, miniature people analysis data or s


Virtual Co-Working platform, miniature people analysis data or s
VectorUsername
aisplResolution
5000x3014pxVirtual Co-Working platform, miniature people analysis data or s


Social network people global growth
VectorUsername
cienpiesResolution
4344x5000pxSocial network people global growth


Data management or cloud networking concept, isometric illustrat
VectorUsername
aisplResolution
5000x2999pxData management or cloud networking concept, isometric illustrat


Data management or cloud networking concept, isometric illustrat
VectorUsername
aisplResolution
5000x2999pxData management or cloud networking concept, isometric illustrat


Global Augmented Reality concept, website template design, minia
VectorUsername
aisplResolution
5000x3749pxGlobal Augmented Reality concept, website template design, minia


Global Augmented Reality concept, website template design, minia
VectorUsername
aisplResolution
5000x3749pxGlobal Augmented Reality concept, website template design, minia


Data Analysis concept based web template, isometric design with
VectorUsername
aisplResolution
5000x2999pxData Analysis concept based web template, isometric design with


Isometric design for Virtual Co-Working Space web template desig
VectorUsername
aisplResolution
5000x3015pxIsometric design for Virtual Co-Working Space web template desig


Isometric design for Virtual Co-Working Space web template desig
VectorUsername
aisplResolution
5000x3015pxIsometric design for Virtual Co-Working Space web template desig


Technology and Innovation concept. Flat vector illustration
VectorUsername
inspiring_teamResolution
4000x4000pxTechnology and Innovation concept. Flat vector illustration


Big Data Analysis concept, business woman maintain data servers
VectorUsername
aisplResolution
5000x2999pxBig Data Analysis concept, business woman maintain data servers


Website template design with 3D letter D, miniature people maint
VectorUsername
aisplResolution
5000x2999pxWebsite template design with 3D letter D, miniature people maint


Big data server connected to multiple local servers, monitor ana
VectorUsername
aisplResolution
5000x2999pxBig data server connected to multiple local servers, monitor ana


Big data server connected to multiple local servers, monitor ana
VectorUsername
aisplResolution
5000x2999pxBig data server connected to multiple local servers, monitor ana


Global remote coworking connection, web template design for Virt
VectorUsername
aisplResolution
5000x3005pxGlobal remote coworking connection, web template design for Virt

Global remote coworking connection, web template design for Virt
VectorUsername
aisplResolution
5000x3005pxGlobal remote coworking connection, web template design for Virt


Successful teamwork people at work giving presentation vector
VectorUsername
SonulkasterResolution
5445x5445pxSuccessful teamwork people at work giving presentation vector


Pie Chart Icon
VectorUsername
xileodesignsResolution
5000x4000pxPie Chart Icon


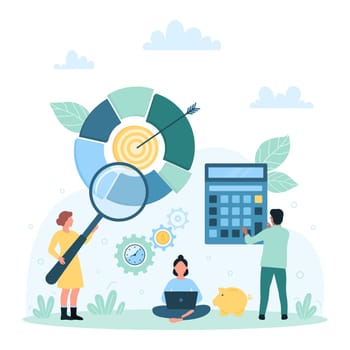
Business analysis, analytics, tiny people analyze pie chart with magnifying glass
VectorUsername
PopovResolution
5835x5835pxBusiness analysis, analytics, tiny people analyze pie chart with magnifying glass

Business analytics of financial results, global trends and work tasks set and tiny people
VectorUsername
LembergvectorResolution
8778x5000pxBusiness analytics of financial results, global trends and work tasks set and tiny people


chart
VectorUsername
vectorstallResolution
5000x5000pxchart


graph
VectorUsername
vectorstallResolution
5000x5000pxgraph


chart
VectorUsername
vectorstallResolution
5000x5000pxchart


graph
VectorUsername
vectorstallResolution
5000x5000pxgraph


chart
VectorUsername
vectorstallResolution
5000x5000pxchart


graph
VectorUsername
vectorstallResolution
5000x5000pxgraph


graph
VectorUsername
vectorstallResolution
4993x5000pxgraph


chart
VectorUsername
vectorstallResolution
5000x5000pxchart